Get Indexology® Blog updates via email.

In This List

Why is the GICS Telecommunications Sector Becoming the Communication Services Sector?

Responsible Investor Europe 2018 Conference: What to Watch for in the Remainder of 2018 and 2019

Trading in Facebook Shows Indexing Has Little to Do With Valuation-Based Dislocations

In Small Caps, Financials Rise Most From GDP Growth

A Primer on Country Classification in the Context of Saudi Arabia’s Upgrade to Emerging Market Status

Why is the GICS Telecommunications Sector Becoming the Communication Services Sector?

Contributor Image
David Blitzer

Former Managing Director and Chairman of the Index Committee

S&P Dow Jones Indices

With the number of telecom companies shrinking, it is clear that communications is much bigger than telecom – Communication Services includes any content delivered on networks.  The old Telecommunications Sector was vanishing because it was missing new and popular ways people communicate now.

GICS – the Global Industry Classification Standard – is widely used to define sectors and industries in indices. The GICS structure of 11 sectors will be updated in September with a new Communication Services Sector combining the existing Telecommunications Sector with parts of the Information Technology and Consumer Discretionary sectors.  The new sector encompasses companies in these areas:

  • Networks — internet, broadband, cellular, broadcast, cable and land lines
  • Content – information, advertising, entertainment, news, social media

Communication is essential in a modern economy.  Without it, the economy would be a series of small isolated villages each trying to be self-sufficient.  With it, information is shared, companies specialize, and trade flourishes.

The content of communications used to be spread across different industries and delivery networks.   Today, interconnected networks deliver virtually any content to any device over any network: text, voice and video via wired, wireless or the internet, television via broadband, newspapers read via smart phones, movies via streaming while social interactions and media follow people everywhere.  Content is crucial for commerce, business, finance, securities trading, and people.

The development that created communication services is the interconnection and sharing of content on networks.

Communication Services is the young sector…

Many communication services companies are young.  Using the dates when companies in the S&P 500 IPO’ed, we can get a sense of how old companies in various GICS sectors are. Companies have been grouped into those that became public before 1973, those listing between 1973 and 1999, and those that IPO’ed this century.  Specific dates were not obtained for the pre-1973 group. Moreover, some mergers and corporate actions obscure the dates. For example, AT&T has a date of 1984; it was created as one of the “Baby Bells” when the original AT&T was broken up in 1984. The original AT&T was incorporated in 1877. The chart shows the proportion of companies in each sector by age group. Communication Services on the left-hand side has the largest green – young – bar of any sector. Utilities, at the right, is the oldest sector. Real Estate includes REITs.  REITs were not listed on the markets in large numbers until the 1970s, explaining the large portion in “middle age.”

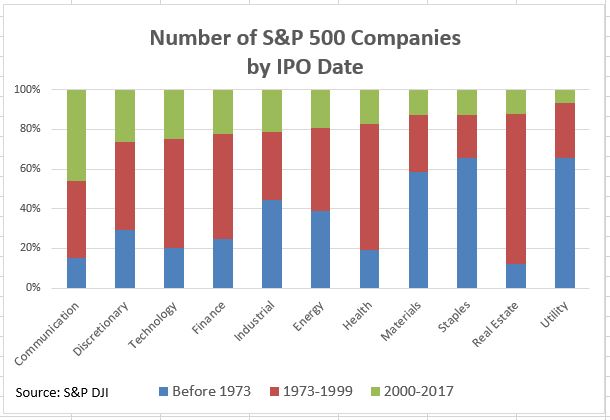
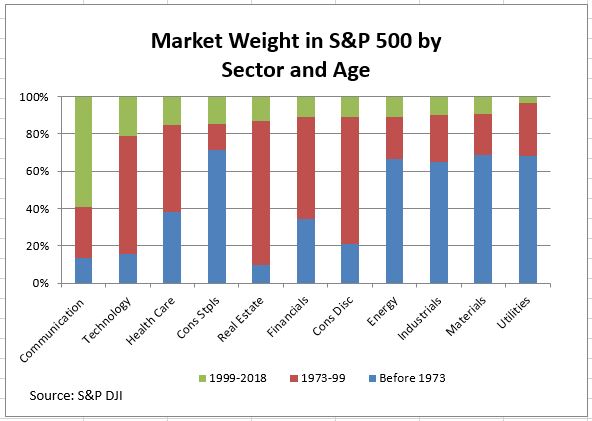
Communication Services is clearly the youngest sector due to social media giants like Alphabet (Google) and Facebook. Technology is now the second youngest and dominates the 1973-99 period when Microsoft and Apple came of age. Industrials, Materials, Energy and Consumer Staples represent growth of the US economy during the first three-quarters of the last century.

The relative youth of Communication Services can be a challenge for security analysts. About 60% of the market capitalization of the sector has less than 20 years of history with little data to track performance over market cycles or to reliably classify stocks by factor. While some companies in the sector IPO’ed before 1973 and a few date back to the first half of the 20th century or earlier, the sector is still experiencing rapid changes.

But Communication Services Didn’t Appear Yesterday

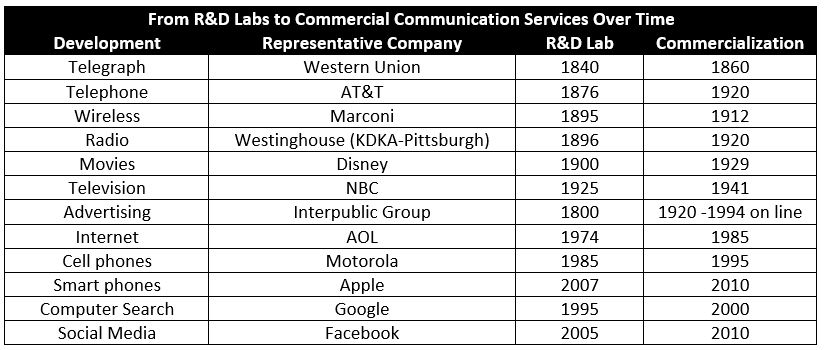
We take communications for granted, acting as though smart phones and the web always existed. However, today’s communication networks weren’t always here; they developed in R&D labs and garages as technology and the economy developed and matured. The table shows how the elements of today’s communication networks moved from the laboratory to commercialization.

The growth of interlinked networks bringing virtually all content together and delivering anything to anyone anywhere is changing the way we view the stock market and driving merger activity. Verizon and AT&T – the bulwark of the old Telecommunication Services Sector – own Yahoo and Time Warner. Comcast owns NBC-Universal while competing with AT&T and Verizon by selling phone service. Slightly over half of smart phones in the US operate with Android. Google and Facebook capture a quarter of global spending on advertising.

Communication services are as important in the stock market as in the economy.  To track these developments in networking and content, GICS is introducing the Communication Services Sector by combining networks and content from the Telecommunications, Information Technology and Consumer Discretionary sectors. The old Telecommunication Services Sector disappears.

The posts on this blog are opinions, not advice. Please read our Disclaimers.

Responsible Investor Europe 2018 Conference: What to Watch for in the Remainder of 2018 and 2019

Contributor Image
Kelly Tang

Former Director

Global Research & Design

In a prior blog, we highlighted that the recent Responsible Investor Europe Conference 2018 gave attendees the sense of a coming of age in the environmental, social, and governance (ESG) movement that could potentially portend a future filled with a greater sense of urgency and call for action in the sustainability world. As noted previously, the drivers behind this heightened sense of urgency stem from a changing political climate that could be potentially less favorable for global ESG issues, the Taskforce on Climate-related Financial Disclosures (TCFD) recommendations on disclosure implementation, and landmark legislative proposals that have been put forth by the European Commission.[1]

The question then arises: What does this call for urgency and action mean for future developments in ESG investing? Here we identify several key themes that we believe will garner more attention in the coming months, extending well into 2019.

  1. Proliferation in ESG-driven investment products on the active and passive fronts to satisfy growing demand, especially from Millennials: The compound annual growth rate (CAGR) of ESG-specific assets rose 23% from 2014 to 2016, compared with the industry average CAGR of 5%.[2] To meet this continued demand, there will be more ESG-related investment products coming to market, as product sponsors continue to build out and extend their suite of ESG offerings.[3] While many products will incorporate standard ESG exclusions, market participants should also expect to see indices and products that incorporate more forward-looking data that follow TCFD recommendations. The Church of England’s Pension Board also announced plans to develop its own index backed by the Transition Pathway Initiative’s analysis of 105 of the world’s largest and highest-emitting public companies across the coal mining, electricity, and oil & gas industries.[4]
  2. S-related issues will continue to be at the forefront: According to a new paper released by the Harvard Kennedy School, “Money, Millennials and Human Rights: Sustaining ‘Sustainable Investing’,” the S in ESG investing is “by far the weakest” element, and the S subcomponent yields the lowest correlation in a comparison of S scores across different rating providers. It recommends that the United Nations Guiding Principles on Business and Human Rights serve as the basis of what analysts, rating providers, and investors measure when it comes to the S aspect. The paper cites an NYU study that revealed that only 12% of S-ratings products target investors as the primary audience, versus 97% and 80% of E- and G-ratings-based products, respectively. Owing to this void in the market, we expect to see more S-related investment products coming to market.
  3. More research on ESG and materiality in a push to classify ESG indicators from “non-financial” to “extra-financial”: In order to integrate ESG factors into the financial analysis process, there will have to be a rethink in the financial industry, leading to a mind shift in classifying ESG information away from the term “non-financial,” which has negatively affected ESG adoption by analysts and portfolio managers in the past. In order to get to the goal of greater acceptance, there will need to be more continued in-depth research examining ESG and materiality. The classification of ESG data as “non-financial” can evolve and take on more significant financial interest to investors and become more aptly “extra-financial.”

There is ample evidence that the three trends are already starting to take shape, with more product sponsors filing for ESG-related investment products. Going into the second half of 2018 and into 2019, we are confident that the above trends will come to fruition, as ESG participants feel the pressure to integrate and implement ESG strategies as it transitions to the mainstream.

[1]   The European Commission has confirmed its first four legislative proposals to spur sustainable finance in the region, covering green definitions and taxonomy, investor duties, retail investing, and benchmarks. In reference to the fourth pillar, the European Commission plans to use a delegated act to create a new category of benchmarks focused on climate mitigation. The first will be a conventional low-carbon benchmark, which will serve to “decarbonize standard benchmarks” by selecting stocks with lower emissions. For those investors that want to be 2 degrees Celsius compliant, the second benchmark—which is described as “impact” focused—will be more ambitious and will seek to meet the Paris Agreement whereby a company’s carbon savings outstrip its carbon emissions. European Commission: Press Release Database “Sustainable finance: Making the financial sector a powerful actor in fighting climate change.” May 24, 2018.

[2]   Kim, Crystal. “Could ESG Become the Wrapper for All Investing?” Barron’s. June 23, 2018

[3]   Vanguard recently announced that it had filed for two ESG exchange traded funds (ETFs)—the Vanguard ESG U.S. Stock ETF and Vanguard ESG International Stock ETF. These indices will exclude controversial industries such as weapons, fossil fuels, etc., in addition to incorporating additional screening for criteria such as diversity, human rights, and anti-corruption. Vanguard. “Vanguard Files For Two New ESG ETFs.” June 27, 2018.

[4]   The Church of England. “Archbishop of Canterbury’s comments at Transition Pathway Initiative summit.” July 2, 2018.

The posts on this blog are opinions, not advice. Please read our Disclaimers.

Trading in Facebook Shows Indexing Has Little to Do With Valuation-Based Dislocations

Contributor Image
Philip Murphy

Former Managing Director, Global Head of Index Governance

S&P Dow Jones Indices

By the close of trading on Thursday, July 26, 2018, shares in Facebook (FB) traded down almost $99 billion, or 19% of their market value. Despite FB’s beginning weight of 2.16%, the S&P 500® was almost flat, losing 0.30% on the day. I suspect you will not hear much about this from those who attempt to create an association between indexing and bubble building. However, for those looking to understand the market, as well as potential changes brought on through the adoption of indexing as an investment strategy, yesterday’s trading in FB shares offered several things to think about.

At the close of July 25, 2018, the S&P 500 included 2,398,606,000 FB shares, substantially all of the company’s shares outstanding. Their value of $217.50 each gave FB a market value of $521.7 billion. At the close of July 26, 2018, the S&P 500 still included the same 2,398,606,000 FB shares. The index did not “sell”, or “drop” in index parlance, one share of FB stock. Nevertheless, by the close of trading, FB was valued at $176.26 per share, or about $422.8 billion for the whole company.

On July 26, 2018, index funds that track the S&P 500 would have no need to sell FB shares, unless they were managing cash flows out of their funds. However, if they were engaging in such trading, they would likely sell proportionate amounts of all stocks in the S&P 500, not only FB. Therefore, if index funds were predominantly responsible for the dislocation in FB shares, the overall market would have sold off to a similar extent.

After the fact, some may draw the conclusion that FB was overvalued. While possibly true, it would not be the most helpful lesson to draw. When the company warned about slowing revenue and contracting margins, it was new information for shareholders to digest. If investors had overvalued the shares on their way up, it was not because of cap-weighted index funds. Those who estimate company value had been overly optimistic and needed to correct their forward-looking assumptions. In other words, active investors set the share price. Investing in market cap-weighted index funds does not create valuation dislocations in individual stocks or bubbles in the market in general. The evidence lies in Facebook

The posts on this blog are opinions, not advice. Please read our Disclaimers.

In Small Caps, Financials Rise Most From GDP Growth

Contributor Image
Jodie Gunzberg

Former Managing Director, Head of U.S. Equities

S&P Dow Jones Indices

On Friday morning the GDP (Gross Domestic Product) for Q2 2018 is set to be announced, and the consensus estimate from the Wall Street Journal survey of more than 60 economists is at 4.1%, the highest (actual) growth since Q3 2014.  Although forecasts greatly vary this quarter, the main factors likely influencing growth are tax policy, retail sales, international trade and manufacturing shipments.

Source: http://projects.wsj.com/econforecast/#ind=gdp&r=12

While U.S. GDP growth is beneficial for stocks in general, the growth has been better for small caps than for large- or mid-caps.  On average for every 1% of GDP growth, the S&P SmallCap 600 has risen 5.2%, while S&P MidCap 400 and S&P 500 have risen a respective 4.9% and 4.0%.  Within small caps, the financials, health care and energy sectors have risen most with growth, gaining on average 6.9%, 6.4% and 6.3%, respectively for every 1% of GDP growth.

Sources: S&P Dow Jones Indices and Bureau of Economic Analysis, U.S. department of Commerce. https://www.bea.gov/national/index.htm#gdp  Data is Gross Domestic Product percent change from preceding period, annual. S&P 600 and sector data is from 1995 – Dec 2017, except Real Estate is from 2002. All Data ending Dec. 29 ,2017. Index data is Total Return.

Although in small caps, financials have delivered 50 basis points more of return than health care from each 1% of GDP growth on average, the financial small cap premium is by far the most sensitive to GDP growth.  For every 1% of GDP growth on average, small cap financials have returned 2.4% more than large cap financials.

Sources: S&P Dow Jones Indices and Bureau of Economic Analysis, U.S. department of Commerce. https://www.bea.gov/national/index.htm#gdp  Data is Gross Domestic Product percent change from preceding period, annual. S&P 600 and sector data is from 1995 – Dec 2017, except Real Estate is from 2002. All Data ending Dec. 29 ,2017. Index data is Total Return.

One contributing factor for the relatively large financials small cap premium is the percentage of revenues that are generated domestically from the small caps versus large caps.  The small cap financials generate about 95% of revenues from the U.S., 17% more than the large cap financials.  The result is the small cap premium in financials is 10.6% year-to-date through July 26, 2018.  While all 3 industry groups of the small cap financials outperformed their large cap counterparts, the small diversified financials outperformed most by 13.5%, just ahead of the small cap outperformance by insurance of 12.8%, and more than the 8.4% premium of small banks.

Source: S&P Dow Jones Indices. Small cap premiums are measured by price return of S&P 600 minus S&P 500 year-to-date through July 26, 2018. The sector is in darkest blue, industry groups are medium blue, industries are light blue and sub-industries are light gray with a blue outline. Only groups with stocks in both large cap and small cap are displayed.

Within the diversified financials, the small cap premium was greatest from the consumer finance industry that may be attributed to strong consumer spending that accounts for more than two-thirds of U.S. economic activity, and is likely being driven by lower taxes and a robust labor market.  Similarly, small consumer staples have been more greatly benefiting than their large cap counterparts, outperforming by 16.6% YTD.  Also contributing to the small cap premium in financials is the life and health insurance sub-industry and the insurance broker sub-industry, with respective small over large performance of 28.3% and 24.3%.  This goes along with the small health care companies have been outperforming their large counterparts significantly this year by an impressive 31.3%.

As U.S. GDP growth accelerates, small cap stocks may continue to outperform large caps, but only if there is quality as in the S&P 600.

The posts on this blog are opinions, not advice. Please read our Disclaimers.

A Primer on Country Classification in the Context of Saudi Arabia’s Upgrade to Emerging Market Status

Contributor Image
Michael Orzano

Head of Global Exchanges Product Management

S&P Dow Jones Indices

Given our recent announcement upgrading Saudi Arabia to emerging market status, it seemed like an apt time to delve a little deeper into the index country classification process and the criteria used to evaluate the status of markets here at S&P Dow Jones Indices (S&P DJI). At the risk of stating the obvious, country classification is perhaps the most fundamental aspect of global benchmark construction, given that country (and related currency) exposures have historically been the most important drivers of risk and return in global equity portfolios. In other words, the countries that are included in your benchmark matter a lot, so it’s critical to understand how country classification decisions are made, as well as any differences that exist between indices published by different providers.

An Overview of S&P DJI’s Country Classification Process and Evaluation Criteria
On an annual basis, S&P DJI conducts a complete review of all countries included in its global equity benchmarks. As described in detail in our country classification methodology, we initially review a series of criteria for each market that covers such areas as macroeconomic conditions, political stability, market size and liquidity, trading and settlement procedures, and the presence of foreign ownership restrictions. Countries must meet certain minimum criteria to be eligible for frontier market status, must pass higher standards for emerging market status, and must pass the most stringent criteria to be considered for developed market status.

In cases where this review indicates a possible change in classification, S&P DJI conducts an in-depth, public consultation requesting feedback from a wide range of market participants. This consultation process is an integral component of the overall country classification decision since core issues under review, such as market accessibility and the efficiency of transacting in local markets, are highly nuanced and may even vary among different types of market participants. S&P DJI typically publishes this annual consultation during the second quarter and it remains open for comment for about three months, with the results announced in the fourth quarter. In order to provide market participants with sufficient time to prepare for country changes, implementation of any changes typically happens at the following year’s September rebalancing.

In addition to the annual consultation, we sometimes conduct “off-cycle” reviews when warranted by changes in market conditions. Our consultation on Saudi Arabia is a recent example of this; the S&P DJI global equity index committee determined that market reforms implemented following our 2017 consultation period warranted a more timely review of the market.

Changes in classification are infrequent, given the index turnover and the associated trading costs borne by asset managers stemming from these large changes. Because of this, country changes are only made when there is a strong consensus among market participants for the change and the conditions supporting the change are seen as extremely unlikely to reverse.

Key Classification Differences
While classification of countries is largely consistent across the largest index providers (e.g., S&P DJI, MSCI, and FTSE Russell each have announced upgrades of Saudi Arabia this year), there are some notable differences to be aware of. Probably the most meaningful involves South Korea, which S&P DJI has classified as a developed market since 2001, but MSCI continues to classify as an emerging market. This difference is important, given that South Korea is the second-largest country in the MSCI Emerging Markets Index at a roughly 15% weight, potentially crowding out less-developed markets from the benchmark.

Another notable distinction to be aware of is that MSCI initiated a partial inclusion of China A-shares in its benchmarks as of June 1, 2018, whereas S&P DJI and FTSE Russell currently have China A-shares under review for inclusion in emerging market indices. Although MSCI’s inclusion of China A-shares has garnered significant attention, it should be noted that the partial inclusion process undertaken by MSCI means that China A-shares currently represent less than 1% of the emerging markets index.

Finally, our 2018 Country Classification Consultation is open for comment until Oct. 15, 2018. In addition to China A-shares, Argentina and Kuwait are under review for reclassification from frontier to emerging market status.

The posts on this blog are opinions, not advice. Please read our Disclaimers.