The end of May 2018 marked another milestone in the history of ETF growth in global markets, with the total assets in ETFs crossing USD 5 trillion. Indian ETF markets are also growing significantly. The support from the Indian government via the Employees’ Provident Fund Organisation and Department of Investment and Public Asset Management, which are promoting investment in ETFs, has helped with the acceptance and adoption of passive investing.
However, with every investment decision comes planning and strategy. Asset allocation is important for a sound portfolio strategy. A core satellite approach has been adopted by many to achieve the necessary portfolio targets. In Indian markets, as active is a well-established strategy and passive is slowly getting a foothold, a combination of the two via core satellite can allow both strategies to be at play.
The large-cap space has long been established to contain companies with large market capitalization and stronger financials, which are understood to be stable and sometimes referred to as blue chip. The benchmark S&P BSE SENSEX consists of large-cap companies and many passive strategies and investment are linked to it today. The Indian market also hosts a wide range of active funds in this space. However, the SPIVA® India Scorecard has highlighted how the benchmark, in this case the S&P BSE 100, has outperformed active funds. It does make one wonder if, rather than going through the effort and spending time sorting through and picking an active strategy, isn’t it may be easier to replicate an index or follow an index fund or ETF?
Exhibit 1 is an example of the outperformance of the S&P BSE 100 over active funds in the past few years. The trend could compel one to think that it may be easier to take a low-cost, diversified, transparent, and flexible option.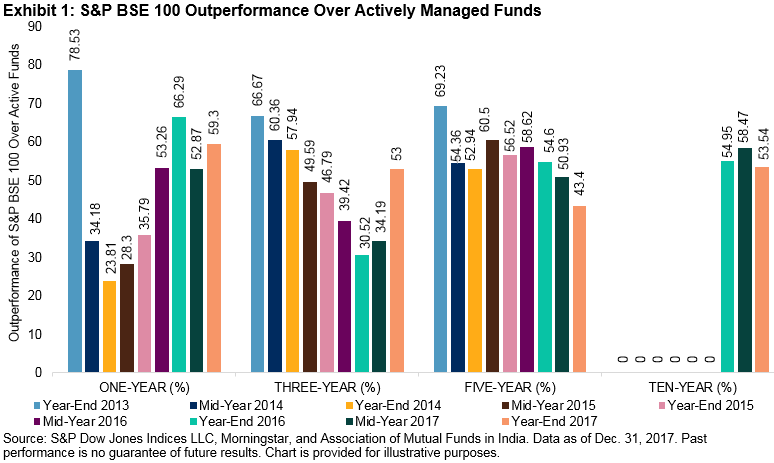
An advantage of index-based investing is low concentration risk. For example, the S&P BSE 100 spreads across a broad basket of 100 securities diversified across sectors. For a more concentrated basket, the S&P BSE SENSEX 50 seeks to measure a group of 50 stocks, while the S&P BSE SENSEX seeks to track a set of 30 stocks. The S&P BSE SENSEX Next 50 is designed to measure the next 50 stocks from the same large-cap space beyond just the top 50 large caps.
Diversification can help with efficient risk management, as the exposure is not concentrated. An index measures a basket of securities, rather than a single stock, with an additional benefit of a wide sectoral exposure. Each of the S&P BSE LargeCap Indices provides exposure across 10 sectors, as per BSE sectoral classification, with various weights. Exhibit 2 demonstrates the sector weights of the S&P BSE LargeCap Indices, which are led by finance at over 30%, consumer discretionary and fast moving consumer goods (FMCG) at over 10%, and basic materials, industrials, and information technology with good shares as well.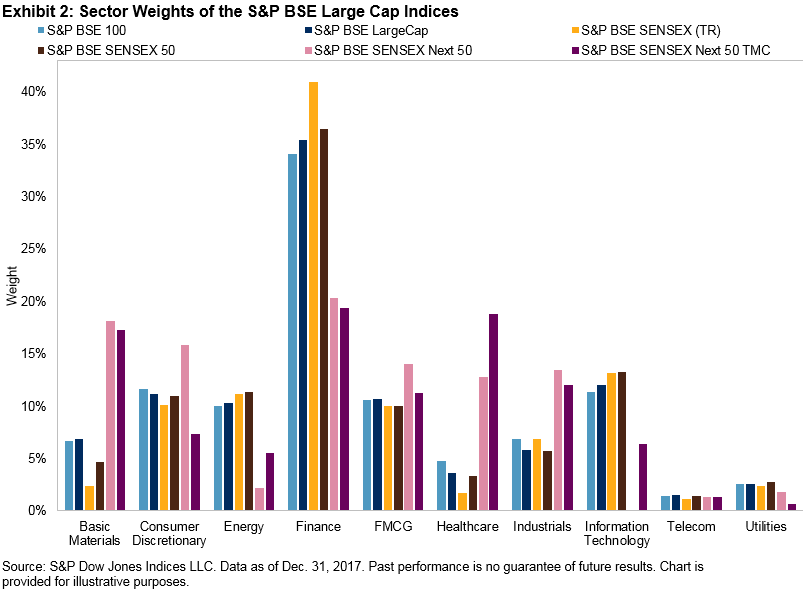
Given that there is a variance in the sectoral balance in each of the large-cap indices, the performance of the indices varies and can provide options with different risk/return profiles. A look at the performance of the sectors in the last few years can help provide a perspective as to how the different sectoral exposures aggregate to a performance characteristic for the indices. Exhibit 3 demonstrates that while information technology was the outperforming sector in the one-year annualized return category, followed by energy, FMCG and finance were the leaders over the long term (i.e., 10 years).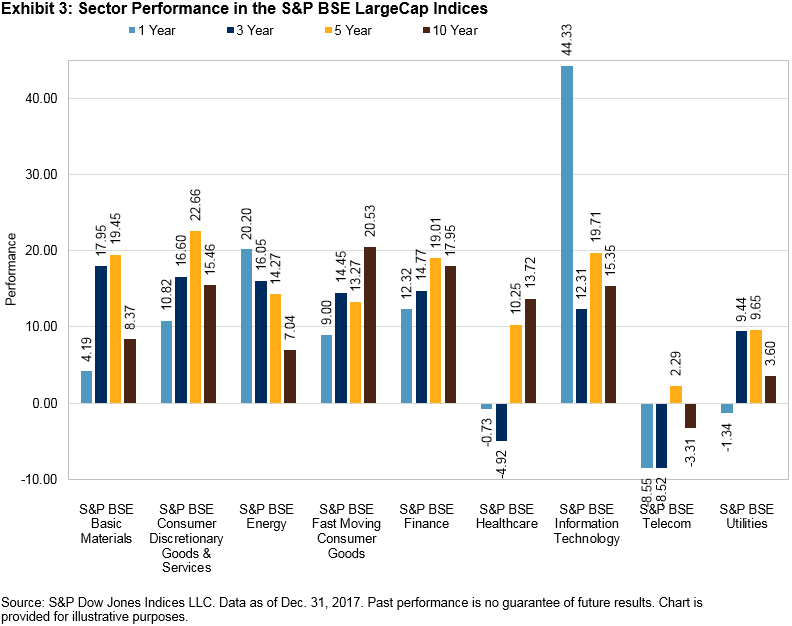
Hence, using indices to measure market segments could provide a cross-sectoral exposure that enables strategies to benefit from diversification.
The indexing route is more diversified than single-stock approaches. Compared with active investing, the methodological approach to index design and consistency helps protect against fund manager bias. The exposure to the large-cap space via indexing as a core strategy offers a portfolio with risk/return characteristics similar to those of the indices.
| Exhibit 4: Risk and Risk-Adjusted Returns of S&P BSE Indices | ||||||
| INDEX | ANNUALIZED RISK (%) | ANNUALIZED RISK-ADJUSTED RETURNS | ||||
| 3-YEAR | 5-YEAR | 10-YEAR | 3-YEAR | 5-YEAR | 10-YEAR | |
| S&P BSE SENSEX (TR) | 13.56% | 13.51% | 20.83% | 0.73 | 1.06 | 0.57 |
| S&P BSE SENSEX 50 (TR) | 13.44% | 13.60% | 21.26% | 0.80 | 1.10 | 0.57 |
| S&P BSE SENSEX 50 TMC (TR) | 16.76% | 18.20% | 23.95% | 0.81 | 1.00 | 0.64 |
| S&P BSE SENSEX Next 50 (TR) | 17.32% | 18.32% | 24.66% | 0.57 | 0.96 | 0.51 |
| S&P BSE 100 (TR) | 13.71% | 14.04% | 21.84% | 0.77 | 1.08 | 0.55 |
| S&P BSE LargeCap (TR) | 13.55% | 13.80% | 21.16% | 0.75 | 1.06 | 0.56 |
Source: AIPL. Data as on June 29, 2018. Past performance is no guarantee of future results. Table is provided for illustrative purposes and reflects hypothetical historical performance. The S&P BSE SENSEX 50 was launched on Dec. 6, 2016. The S&P BSE SENSEX Next 50 was launched on Feb. 27, 2017. The S&P BSE SENSEX NEXT 50 TMC was launched on Apr 18, 2018.
| Exhibit 5: Annualized Returns of S&P BSE Indices | ||||
| INDEX | ANNUALIZED RETURNS (%) | |||
| 1-YEAR | 3-YEAR | 5-YEAR | 10-YEAR | |
| S&P BSE SENSEX (TR) | 15.96 | 9.9 | 14.37 | 11.77 |
| S&P BSE SENSEX 50 (TR) | 15.1 | 10.75 | 15 | 12.22 |
| S&P BSE SENSEX Next 50 (TR) | 1.77 | 9.88 | 17.65 | 12.49 |
| S&P BSE SENSEX Next 50 TMC (TR) | 6.32 | 13.5 | 18.14 | 15.44 |
| S&P BSE 100 (TR) | 12.94 | 10.58 | 15.21 | 12 |
| S&P BSE LargeCap (TR) | 13.24 | 10.14 | 14.69 | 11.79 |
Source: AIPL. Data as on June 29, 2018, 2018. Past performance is no guarantee of future results. Table is provided for illustrative purposes and reflects hypothetical historical performance. The S&P BSE SENSEX 50 was launched on Dec. 6, 2016. The S&P BSE SENSEX Next 50 was launched on Feb. 27, 2017.The S&P BSE SENSEX NEXT 50 TMC was launched on Apr 18, 2018.
The posts on this blog are opinions, not advice. Please read our Disclaimers.