In April 2017, S&P Dow Jones Indices launched the S&P GSCI Dynamic Roll Reduced Energy 70/30 Futures/Equity Blend. This index is designed to measure the performance of a multi-asset allocation strategy that consists of a futures-based commodities index and an equity index that is based on various commodity-related GICS® subsectors.
The futures portion is represented by the S&P GSCI Dynamic Roll Reduced Energy, which reduces the weight of energy relative to the other commodities in the index, compared with the production-weighted benchmark. It also utilizes a flexible futures contract rolling strategy based on the shape of the forward curve to alleviate the negative impact of rolling into contango and potentially limiting volatility exposure to the commodity market. The futures included in the index cover agriculture, energy, livestock, and industrial and precious metals.
The equity portion is represented by the S&P GSCI Sector Equities, which is designed to measure the performance of companies involved in agriculture and livestock, the exploration and production of industrial and precious metals, and the exploration and production of coal, gas, and oil.
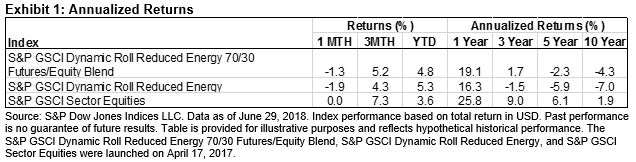
In the past year, commodity futures and equities posted double-digit gains, with the S&P GSCI Sector Equities up 25.8%, the S&P GSCI Dynamic Roll Reduced Energy up 16.3%, and the blend up 19.1% (see Exhibit 1).
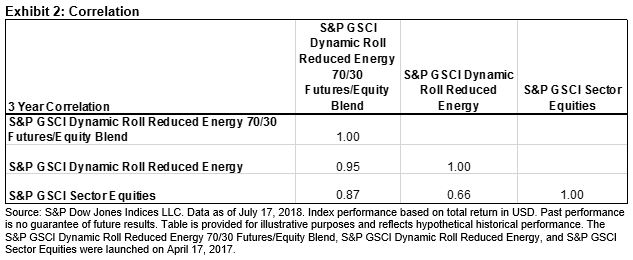
An index that includes both commodity equity and futures can provide more diversification than an index composed of only one asset class. As seen in Exhibit 2, the correlation between the assets was relatively low.
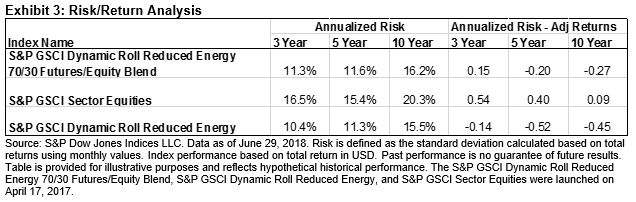
In terms of risk/return analysis, looking at the three-year period, the blended portfolio outperformed the commodity futures index, returning 1.7% compared with -1.5%. It also had a lower annualized risk, at 11.3%, compared with the 16.5% of the equity-only portion (see Exhibit 3).
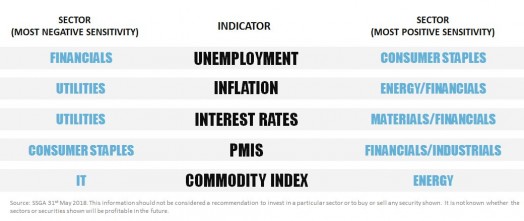
Analysis of the indices’ inflation beta, which measures the sensitivity of an asset’s nominal prices to changes in inflation levels, showed that commodity futures and producers provided significant inflation protection. The futures-only index provided an inflation beta of 12.0, which indicated that the index historically increased 12% on average for a 1% increase in inflation. The commodity equity index’s inflation beta was 10.4, while the blend’s was 11.6%.
The posts on this blog are opinions, not advice. Please read our Disclaimers.