Get Indexology® Blog updates via email.

In This List

The Department of Labor and ESG Guidance: Is the Pendulum Shifting?

How an Industry Reduced Its Carbon Pricing Risk by 922%

Low Inflation isn’t Unusual

Momentum's Minsky Moment?

Integrating Carbon Risk With the Quality Factor

The Department of Labor and ESG Guidance: Is the Pendulum Shifting?

Contributor Image
Kelly Tang

Former Director

Global Research & Design

In late April 2018, the Department of Labor’s (DOL) Office of Regulations and Interpretations issued the Field Assistance Bulletin No. 2018-01, clarifying guidance on how investment managers should interpret the DOL’s prior Interpretive Bulletins (IBs) issued in 2015 and 2016. Issued during the Obama administration, the IBs detail the exercise of shareholder rights, written statements of investment policy, and fiduciary standards when considering economically targeted investments (ETIs).

An ETI is the equivalent to a socially responsible investment to the DOL. The DOL is empowered under the Employee Retirement Income Security Act (ERISA) to regulate fiduciary matters pertaining to employer-sponsored retirement funds, such as 401(k) accounts and pensions. State and local retirement plans, despite being governed by state laws, often refer to the U.S. DOL for guidance.

In the last several years, a number of major public retirement plan managers have become active in submitting numerous shareholder proposals to address their ESG-related concerns. As ESG investing becomes more popular, the DOL is intent on reminding fund managers directly that fiduciaries may not sacrifice returns or assume greater risks in order to promote ESG policy goals when making investment decisions. In short, their position is that returns must come first, regardless of a fund manager’s ethical motivations.

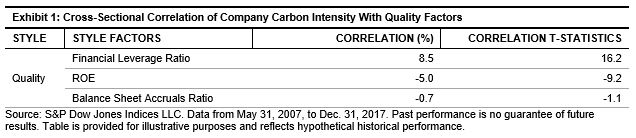
It is helpful to revisit the DOL’s prior IBs issued in 2015 and 2016 (see Exhibit 1). In IB 2015-01, the DOL highlighted the concept of “tie-breakers” in that when competing investments are economically equivalent, then plan fiduciaries can use ESG-related considerations as tie-breakers for an investment choice. IB 2016-01 stated that plan fiduciaries may engage in shareholder proposal activities if they believe it is likely to enhance the value of the plan’s investment in the corporation, after taking into account the costs involved. The 2016 bulletin also noted that “investment policy statements are permitted to include policies concerning the use of ESG factors to evaluate investments, or on integrating ESG-related tools, metrics, or analyses to evaluate an investment’s risk or return.”

Sensing that the pendulum may have shifted too far, the DOL’s current release is a clarification statement. Its clarification points are as follows.

  1. Fiduciaries must always put first the economic interests of the plan in providing retirement benefits
  2. It is not mandatory that investment policy statements contain guidelines on ESG investments or integrating ESG-related tools in order to comply with ERISA
  3. Fiduciaries “may not routinely incur significant plan expenses to pay for the costs of shareholder resolutions … or actively sponsor proxy fights on environmental or social issues”

However, understanding the growing interest in ESG investments, the DOL did indicate that supporting shareholder proposals when the activity is “likely to enhance the economic value of the plan’s investment in that corporation after taking into account the costs involved” would be acceptable.

This current bulletin should not warrant a “doom and gloom” reaction, and instead market participants could view it as a call from the DOL to be more cautionary and judicious in conducting a cost/benefit analysis to ESG investing.

In addition, this bulletin reinforces the importance of materiality and linking ESG-related investing to those issues that are most material for future stock performance. The difficulty lies in the fact that ESG materiality differs for different industries, and identifying these differences requires more research, especially for evidence-based findings.

In terms of implications for passive investing, the current guidance has the potential to sway fiduciaries into index-based ESG solutions that integrate the financial merits of ESG and impact-based goals. The bulletin distinguished between “ESG-themed funds (e.g., Socially Responsible Index Fund, Religious Belief Investment Fund, or Environmental and Sustainable Index Fund),” from funds “in which ESG factors may be incorporated…as one of many factors in ordinary portfolio management and shareholder engagement decisions.” The former seems to be more concerning to the DOL than the latter which opens the possibility of favoring some ESG products and strategies over others.

The posts on this blog are opinions, not advice. Please read our Disclaimers.

How an Industry Reduced Its Carbon Pricing Risk by 922%

Contributor Image
Rochelle March

Senior Analyst

Trucost, part of S&P Dow Jones Indices

Companies that act now to invest in low carbon technologies have the chance to maintain their license to grow and avoid carbon pricing costs that would significantly reduce profits. For example, in 2020, the technology sector’s investments in energy efficiency for their U.S. data centers could avoid over USD 6.9 billion in carbon costs and show a 59% reduction in operating margins.

Growing global carbon prices can affect companies through regulatory costs imposed on energy and fuel price increases, or through suppliers passing on these costs to the company. Trucost developed its Corporate Carbon Pricing Tool to help companies understand how this carbon pricing risk exposure can affect their competitiveness in a climate-challenged future.

Carbon pricing risk can affect all business sectors. One sector in particular has been successful in reducing its carbon pricing risk in the future. In just the past five years, data centers have turned what was an exponential increase in energy demand into practically a flat line.

For U.S. data centers alone, there was a 90% increase in electricity use from 2000-2005, as the data center industry saw booming growth.[1] From 2005-2010, this energy use increased only by about 24%. Since 2010, electricity consumption has only increased by about 4%. An overall efficiency trend has helped keep data center energy use steady, despite the technology sector’s continued expansion.

This efficiency trend has helped to drastically reduced the energy usage of data centers, which otherwise would have needed an additional 600 billion kWh by 2020 to meet demand.1 Although many efficiency gains have been made, there remains opportunity to be aggressive in pursuing additional strategies that could decrease electricity consumption by another 33 billion kWh by 2020.

Trucost ran an analysis of three scenarios as depicted in a report1 on U.S. data center usage to help illustrate how data centers have reduced their carbon pricing risk as well as energy intensity. The first scenario depicts the carbon pricing risk for U.S. data centers without any efficiency trend, the second with the current efficiency trend, and the third with adoption of additional efficiency strategies.


The analysis shows how data centers have reduced their carbon pricing risk. A number of factors have helped support this efficiency trend.

  • Leading companies have set an example and pushed the industry to innovate quickly in order to save energy costs as well as drive performance. Large internet companies like Google, Facebook, and Amazon have made sizable investments in energy efficiency and renewable energy installations.[2]
  • With as much as 48% of operational costs[3] originally dedicated to data center energy needs, there exists a strong business case to invest in energy efficiency.
  • Data centers continue to experience strong growth,[4] resulting in new builds that are outfitted with updated servers, infrastructure, and networks with increasing energy efficiency.
  • Technological developments, such as server virtualization,[5] movement to cloud services, and more efficient servers has contributed to an overall increase in efficiency.
  • There is an industry movement toward a “hyperscale shift” to large data centers configured for maximum productivity that often need fewer servers to provide the same service as smaller data centers.

As more investors request that companies take responsibility for future climate risks,[6] the case of data centers gives us an example of how it is possible to successfully reduce climate risk exposure while still pursuing continuous market growth.

[1]   https://eta.lbl.gov/sites/all/files/publications/lbnl-1005775_v2.pdf

[2]   http://fortune.com/2016/06/27/data-center-energy-report/

[3]   https://www.energystar.gov/ia/partners/prod_development/downloads/EPA_Report_Exec_Summary_Final.pdf

[4]   https://cloudscene.com/news/2017/12/2018-data-center-predictions/

[5]   https://www.techopedia.com/definition/688/server-virtualization

[6]   https://www.fsb-tcfd.org/

The posts on this blog are opinions, not advice. Please read our Disclaimers.

Low Inflation isn’t Unusual

Contributor Image
David Blitzer

Former Managing Director and Chairman of the Index Committee

S&P Dow Jones Indices

Fed watchers and bond holders worry that inflation could spike, tempting the Fed to boost rates much farther than the current half percentage point the market expects in the rest of 2018.  With the Federal Open Market Committee, the central bank’s policy makers, meeting today and tomorrow these concerns are front and center.  This morning’s report from the Bureau of Labor Statistics showed the CPI up 0.2% in May and 2.8% over the last 12 months. Excluding the volatile factors of food and energy, the 12 month figure was 2.2%.  These figures are a bit higher than recent numbers: since the start of 2016, the average inflation rate was 1.8%.

Over the last 70 years inflation was as low as -3.0% during the 1948-49 recession and as high as 14.6% in 1980 during the second oil crisis.  High inflation is caused by oil price surges or wars. Inflation usually falls when the economy slows, but it takes a deep recession like the last one in 2007-9 to send it into negative numbers.  The chart shows the history of inflation since 1949, the shaded sections are recessions. There were four times when inflation topped 7.5%.  The first in 1948-9 was a spending surge at the end of World War II followed shortly by the Korean War. The two peaks in the 1970s were the 1973 and 1979 oil crises. Most notable though is the general trend – over seven decades the inflation rate remains essentially between zero and five percent. The average over the entire period, including spikes, is 3.5%.

Recently some analysts suggested that the internet and the rising share of on-line retail sales compared to traditional shopping is keeping inflation down. Research cited in the New York Times shows that price increases for goods sold on-line are generally lower than price increases for the same goods sold off-line.[i]  The impact of on-line sales are likely to increase. The share of retail sales on-line is now about 10%; at this rate it will be double that in 2024.

Today’s inflation rate is lower than the long term average.  Barring a war or another oil embargo and crisis, the figure should stay close to current levels.

[i] Austan Goolsbee and Peter Klenow, “Internet Rising, Prices Falling: Measuring Inflation in a World of E-Commerce,” working paper 2018-35, University of Chicago

The posts on this blog are opinions, not advice. Please read our Disclaimers.

Momentum's Minsky Moment?

Contributor Image
Tim Edwards

Managing Director, Index Investment Strategy

S&P Dow Jones Indices

U.S. equity funds following momentum (or relative strength) strategies have generally performed well recently, and their performance has been rewarded with inflows.  This is important because momentum, uniquely among investment styles, is self-reinforcing – until it isn’t.

Typically, as factors become more popular, their excess returns are likely to diminish.  For example: the more value investors dominate the market, the harder it becomes to find cheap stocks.  But momentum is different: momentum-based strategies, by their nature, focus on the market’s recent winners.  Flows into those strategies may further inflate those winning stocks, which can attract (or convert) still more trend followers, and so on in an inflationary cycle.

However, a “Minsky Moment” may await: eventually, bubbles pop.  The tipping points are hard to predict; it could be that valuations become so extended that they deter other investors, or it may even be a relatively minor event – such as a disappointing earnings report from one of the market’s current darlings.  Momentum-driven bubbles are inherently unstable.  At the first hint of a change in the trend, the most sensitive momentum investors will sell, amplifying the downtown and thereby reinforcing the strength of the “sell” signal to other momentum investors.  The more trend followers there are, the more dramatic the reversal.  The popularity of momentum accelerates both its performance and its sensitivity to a change in regime.  Hence, therefore, identifying when momentum appears to be both gaining in popularity – and performing particularly well – can determine whether a cautious or even contrarian approach is more prudent.

But what of the present?  2017 was a banner year for momentum – as represented by the S&P 500 Momentum Index.  The first six months of 2018 have seen this outperformance accelerate.  Exhibit 1 provides historical context by plotting the historical relative outperformance of momentum, controlled for the S&P 500’s concurrent stock-level dispersion.

Exhibit 1: Momentum’s Dispersion-Adjusted Relative Performance Reaches a 12-Year High.

The historical relative performance of momentum is clearly cyclical: when the series becomes elevated, it subsequently falls.  These declines represent periods of underperformance for investors tracking the momentum index.  The relatively high current reading suggests, at a minimum, that caution may be in order.  Nevertheless, it remains a hard task to predict exactly when the trend might reverse.  Indeed, as was the case in the late 1990s, we may yet see further relative outperformance.  But the longer this outperformance continues, the more unstable it may become.  And as Vanguard’s John Bogle put in his 10 rules for investing “reversion to the mean is a virtual certainty.”


The posts on this blog are opinions, not advice. Please read our Disclaimers.

Integrating Carbon Risk With the Quality Factor

Contributor Image
Wenli Bill Hao

Director, Factors and Dividends Indices, Product Management and Development

S&P Dow Jones Indices

In a prior blog, we demonstrated that a sector-relative, carbon-efficient portfolio was superior to a sector-unconstrained one when forming low-carbon portfolios. In this blog, we explore the integration of carbon risk in quality factor portfolios. High-quality companies seek to generate higher profitability and enjoy more stable growth than “average” companies. Equally important, high-quality companies seek to adopt a conservative, yet effective, capital structure that allows them to grow. Finally, high-quality companies tend to exercise prudence in the administration of company affairs.[1]

We capture the quality investment style by equally weighting three factors: financial leverage ratio, return on equity (ROE), and balance sheet accruals ratio.

Correlation of Carbon Intensity and Quality Factors

We first analyzed the firm-level correlation between carbon intensity and each of the three quality factors in our test universe for each rebalance period (every three months), then we took the average of the cross-sectional correlations and calculated the t-statistics (see Exhibit 1).[2]

We can see that companies that are more carbon-efficient (or have lower carbon intensity) tended to have lower financial leverage ratios while displaying higher ROE, both of which were statistically significant at a 95% confidence level. In sum, carbon-efficient firms tended to be high-quality companies. Such findings are not surprising, as high-quality companies have more prudent capital structure, higher profitability, and higher earnings quality than their competitors. As a result, high-quality companies may have the financial strength to meet the market obligations that come with moving toward a low-carbon economy.

Integrating Carbon Risk With Quality Portfolios

One way to incorporate carbon risk with the quality factor is to construct an integrated quality-carbon composite score. The quality style score is defined as the equal-weighted combination of the three quality factors, while the quality-carbon composite score is defined as the equal-weighted combination of the quality style score and the carbon-efficiency score. Quintile portfolios were constructed based on the integrated quality-carbon composite score.

We compared the hypothetical quality-carbon-integrated portfolios (quality + carbon efficiency and sector-relative (SR) quality + carbon efficiency) to the unconstrained carbon-efficient portfolio, the quality portfolio, and the underlying benchmark (see Exhibit 2).

The quality + carbon efficiency portfolio had slightly lower risk-adjusted returns (0.78) than the quality portfolio (0.80). However, the carbon intensity of the quality + carbon efficiency portfolio was reduced to 19% of the underlying universe. The sector-relative quality + carbon efficiency portfolio also outperformed the benchmark on a risk-adjusted basis, albeit with a lower Sharpe ratio than its quality and quality + carbon efficiency counterparts.

Integrated Quality-Carbon Portfolios Maintained Target Factor Exposure

In this section, we examine the quality style exposure of integrated quality-carbon portfolios. We compared the weighted average style z-score of the integrated portfolios to the pure factor portfolio, as well as the broad benchmark (see Exhibit 3).

We can see that combining carbon efficiency with quality portfolios had little impact on quality style exposure, as measured by the weighted average z-score and t-statistics (the critical value of 95% confidence level is 1.99) from two sample t-tests.

The results from Exhibits 1, 2, and 3 showed that carbon-efficient firms tend to be high-quality companies. Moreover, integrated quality-carbon-efficient portfolios tend to have improved risk-adjusted returns and tend to be more carbon efficient over the underlying benchmark, while maintaining similar factor exposure level in comparison with pure quality factor portfolios. In the next blog, we will explore sector composition, risk exposure, and risk composition of quality-carbon-efficient portfolios.

[1]   D. Ung, P. Luk, and X. Kang. “Quality: A Distinct Equity Factor?” 2014. S&P Dow Jones Indices LLC.

[2]   B. Hao, A. Soe, and K. Tang. “Carbon Risk Integration in Factor Portfolios.” 2018. S&P Dow Jones Indices LLC.

The posts on this blog are opinions, not advice. Please read our Disclaimers.