U.S. equity funds following momentum (or relative strength) strategies have generally performed well recently, and their performance has been rewarded with inflows. This is important because momentum, uniquely among investment styles, is self-reinforcing – until it isn’t.
Typically, as factors become more popular, their excess returns are likely to diminish. For example: the more value investors dominate the market, the harder it becomes to find cheap stocks. But momentum is different: momentum-based strategies, by their nature, focus on the market’s recent winners. Flows into those strategies may further inflate those winning stocks, which can attract (or convert) still more trend followers, and so on in an inflationary cycle.
However, a “Minsky Moment” may await: eventually, bubbles pop. The tipping points are hard to predict; it could be that valuations become so extended that they deter other investors, or it may even be a relatively minor event – such as a disappointing earnings report from one of the market’s current darlings. Momentum-driven bubbles are inherently unstable. At the first hint of a change in the trend, the most sensitive momentum investors will sell, amplifying the downtown and thereby reinforcing the strength of the “sell” signal to other momentum investors. The more trend followers there are, the more dramatic the reversal. The popularity of momentum accelerates both its performance and its sensitivity to a change in regime. Hence, therefore, identifying when momentum appears to be both gaining in popularity – and performing particularly well – can determine whether a cautious or even contrarian approach is more prudent.
But what of the present? 2017 was a banner year for momentum – as represented by the S&P 500 Momentum Index. The first six months of 2018 have seen this outperformance accelerate. Exhibit 1 provides historical context by plotting the historical relative outperformance of momentum, controlled for the S&P 500’s concurrent stock-level dispersion.
Exhibit 1: Momentum’s Dispersion-Adjusted Relative Performance Reaches a 12-Year High.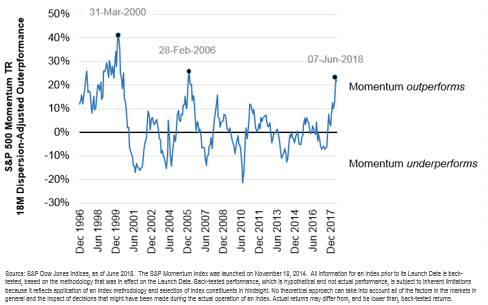
The historical relative performance of momentum is clearly cyclical: when the series becomes elevated, it subsequently falls. These declines represent periods of underperformance for investors tracking the momentum index. The relatively high current reading suggests, at a minimum, that caution may be in order. Nevertheless, it remains a hard task to predict exactly when the trend might reverse. Indeed, as was the case in the late 1990s, we may yet see further relative outperformance. But the longer this outperformance continues, the more unstable it may become. And as Vanguard’s John Bogle put in his 10 rules for investing “reversion to the mean is a virtual certainty.”
The posts on this blog are opinions, not advice. Please read our Disclaimers.