Since 2015, S&P Dow Jones Indices has been reporting on the performance of actively managed equity funds in Brazil through the S&P Indices Versus Active (SPIVA®) Latin America Scorecard. Aside from the performance of the funds, we observed that a significant number of Brazilian equity funds have liquidated or merged within the past five years. Funds can close for a variety of reasons, such as high operational costs, new legislation, underperformance, etc., and when they do, they liquidate their assets, or rarely, merge with another fund. In this blog, we examine the performance of these now-closed funds while they were active to determine if underperformance was a potential cause for fund liquidation.
Using the Brazilian Equity Funds category data and based on the SPIVA Year-End 2017 Latin America Scorecard, we grouped the funds by one-, three-, and five-year periods. Exhibit 1 combines data from Reports 1 (Outperformance) and 2 (Survivorship) of the scorecard and treats liquidated and merged funds as underperforming the benchmark, since they don’t have full performance history for the respective lookback period. The treatment ensured that survivorship bias of the fund universe was eliminated. If dead funds were excluded from the analysis, there would be an upward bias in the percentage of funds beating the benchmark, since poor performance could be the cause for funds to be shut down.
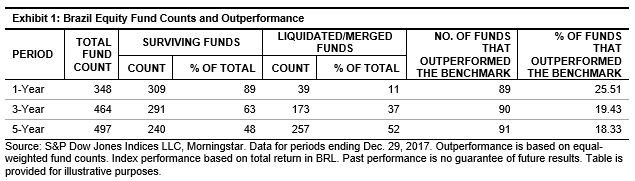
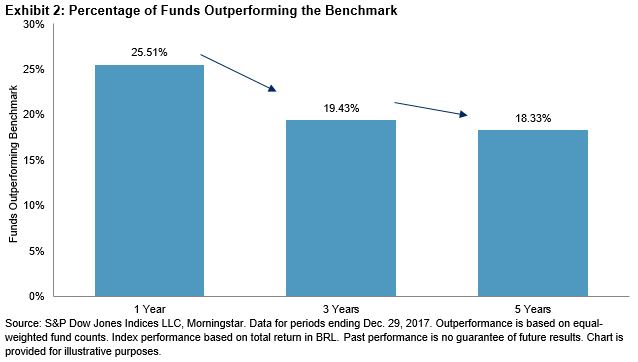
We first look at the fund counts for each period—over 37% of funds closed down within the three-year period, and more than half of the entire category was liquidated or merged within the five-year period. We also show the count and percentage of funds that outperformed the S&P Brazil BMI—the majority of funds underperformed the benchmark in all three periods. In addition, the percentage of funds that outperformed the benchmark decreased over the longer time horizons (see Exhibit 2).
To determine if underperformance was the likely driver of the funds closing down, we compared the performance of the dead funds with the S&P Brazil BMI for the period that they were active. The measurement period for each fund was based on the lookback period start date (December 2012), or on the fund start date if it was more recent, and the full month prior to the fund’s closure. To be included in the analysis, the funds had to have data for the full period, or up to one month prior to closure. The one-month buffer enabled a larger number of funds to be analyzed. Funds without performance data or with significantly less available data than anticipated were excluded from the analysis. For the remaining funds, we calculated the annualized return of the fund and the benchmark for each fund’s measurement period.
Exhibit 3 compares the median returns of the closed-down funds relative to the S&P Brazil BMI. The funds were grouped by the number of months measured: 1-12 months, 13-36 months, and 37-60 months. As a note, while funds were grouped by measurement period length, the actual dates measured would be different for each fund.
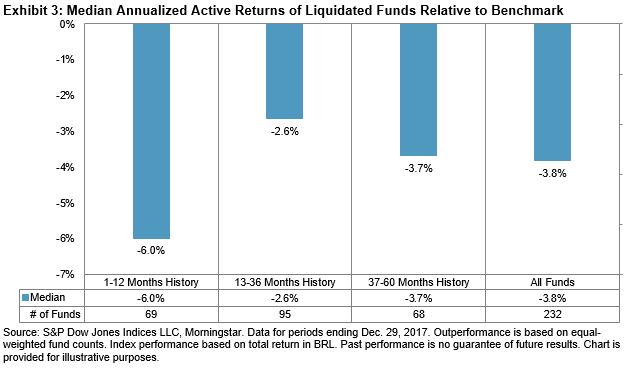
As a group, liquidated funds underperformed the benchmark by a meaningful amount, regardless of the measurement period length. Overall, the median liquidated fund underperformed the benchmark by 3.8% per year. The performance of these funds was considerably lower than the five-year median annualized active return of -1.64% reported for the category in the SPIVA Year-End 2017 Latin America Scorecard.[i] The performance differential between liquidated funds and surviving funds helped us to confirm two things: 1) that performance was a likely driver in fund closures, and 2) the underperformance assumption used in SPIVA Latin America Scorecards for liquidated funds is a valid approach. In a follow-up blog, we will look at the potential impact of survivorship bias on the outperformance figures in the SPIVA Latin America Scorecard.
[i] The five-year second quartile return of the Brazil Equity category was 5.34%, as shown in Report 5 in the SPIVA Year-End 2017 Latin America Scorecard. For the same time period, the S&P Brazil BMI returned 6.98% (see Report 3 or 4), leading to the underperformance figure of -1.64%.
The posts on this blog are opinions, not advice. Please read our Disclaimers.