A topic commonly brought up when interest rates rise is the impact that rates have on the performance of low volatility indices. Several studies[1][2] have shown that low volatility portfolios have exposure to rising interest rate risk. One of the main drivers of this exposure stems from the bond-like characteristics of sectors usually favored by low volatility strategies, such as utilities and consumer staples. Thus, rising interest rates can negatively affect the performance of indices, such as the S&P 500® Low Volatility Index. In this blog, we review the historical performance of the S&P 500 Low Volatility Index to the S&P 500 in rising interest rate periods to confirm whether or not this is the case.
The S&P 500 Low Volatility Index outperformed the S&P 500 in the long term on an absolute and risk-adjusted basis, but in periods of rising interest rates, the index has underperformed. Using the 10-year U.S. Treasury Bond yield as the proxy for interest rates, Exhibit 1 shows the historical performance of the S&P 500 Low Volatility and S&P 500 indices in periods of significantly increased interest rates. For the purpose of this study, rising interest rate periods are classified as significant when rates rose by 1% or more on a month-end basis.
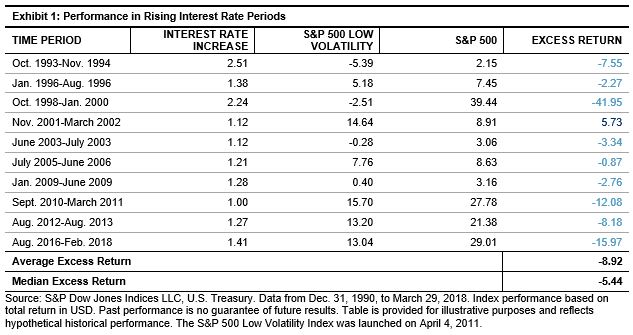
Going back to 1991, there have been 10 non-overlapping periods of rising interest rates. This includes the most recent environment through the end of February 2018, as interest rates have been trending upwards since the summer of 2016. The S&P 500 Low Volatility Index underperformed the S&P 500 in 9 of the 10 periods, with an average excess return of -8.92% and median excess return of -5.44%.
The largest underperformance was seen during the technology boom in the late 90s as interest rates rose by over 2%. In this period, the S&P 500 Low Volatility Index underperformed by nearly 42% from October 1998 through January 2000. One of the main drivers of underperformance stemmed from the S&P 500 Low Volatility Index having no exposure to the information technology sector, which unsurprisingly was the best performing sector during the technology boom. The information technology sector is cyclical and generally has performed well in increased interest rate periods, while the utilities sector has significantly underperformed.[3]
To further isolate the impact of interest rate movements, monthly hit rates and average excess returns were calculated. Exhibit 2 shows these two statistics for the S&P 500 Low Volatility Index relative to the S&P 500 going back to 1991. The time period was broken out between months when interest rates rose and when rates fell. No minimum change threshold was incorporated; thus, all months were included in the analysis.

It is evident that there is a difference in relative performance based on the direction of interest rate changes. The S&P 500 Low Volatility Index underperformed the benchmark 60% of the time when interest rates rose and underperformed by an average of -0.60%. Conversely, the S&P 500 Low Volatility Index performed better than the benchmark when interest rates declined.
In a forthcoming blog, we will use regression analysis to further examine the robustness of the results found in this blog. In particular, we will test if there is a relationship between the magnitude of interest rate changes and resulting excess returns.
[1] Blitz, D., B. van der Grient, and P. van Vliet. “Interest rate risk in low-volatility strategies.” 2014.
[2] Driessen, J., I. Kuiper, and R. Beilo. “Does Interest Rate Exposure Explain the Low-Volatility Anomaly?” 2017.
[3] Based on the same periods in Exhibit 1, the Information Technology sector had a median excess return of 4.26% versus the S&P 500, while the utilities sector had a median excess return -13.89%.
The posts on this blog are opinions, not advice. Please read our Disclaimers.