The growth rate of the Indian passive investing space has been impressive. Though it’s still early days for this market, the statistics are clear. At year-end 2017, Indian ETF assets stood at INR 78,000 crores (USD 12 billion), with an annualized growth rate of 76.6% over the past four years.1 For India, the passive investing space gained popularity, with a good deal of interest in gold ETFs, but in the past few years, interest has shifted to equity ETFs, which have gained prominence. This trend was supported by Indian government initiatives that provided the necessary boost, with the Central Public Sector Enterprises (CPSE) ETF and by the Employees’ Provident Fund Organisation (EPFO) investments allocated to equity ETFs.
However, for a nascent market like India, the preference is for the market benchmarks and size and sector plays. For example, the S&P BSE SENSEX, S&P BSE SENSEX 50, and S&P BSE 100 are indices that seek to represent Indian market dynamics and can be selected for indexed solutions. The markets are clearly indicating signs of a growing acceptance of passive investing. So what is it that is working for indexing?
Lower Cost
Lower cost is an important contributor. Passive investing eliminates the active manager’s costs for trading, research, management fees, etc. To get a better understanding, Exhibit 1 shows the expense ratio limit for asset management companies.
| Exhibit 1: Expense Ratio of Asset Management Companies | ||
| AVERAGE WEEKLY NET ASSETS | LIMIT APPLICABLE ON EQUITY SCHEMES (%) | LIMIT APPLICABLE ON DEBT SCHEMES (%) |
| First INR 100 Crores | 2.50 | 2.25 |
| Subsequent INR 300 Crores | 2.25 | 2.00 |
| Subsequent INR 300 Crores | 2.00 | 1.75 |
| On the Balance Assets | 1.75 | 1.50 |
Source: S&P Dow Jones Indices LLC. Data as of Dec. 31. 2017. Table is provided for illustrative purposes.
An additional 30 bps can be charged if 30% of new inflows or 15% of existing assets are from cities outside the top 15.
In comparison, current ETFs in India are operating at much lower costs. Some of the lower expense ratios vary from 5 bps (which is 0.05%) to as low as 0.9 bps (0.009%) in the case of the S&P BSE BHARAT 22 Index ETF.
This 2% difference in cost (and more in some cases) offers a strong case for passive investing. The growing popularity of passive options has the potential to offer cost-effective solutions to market participants.
Exhibit 2: Expense Ratio of ETFs in India
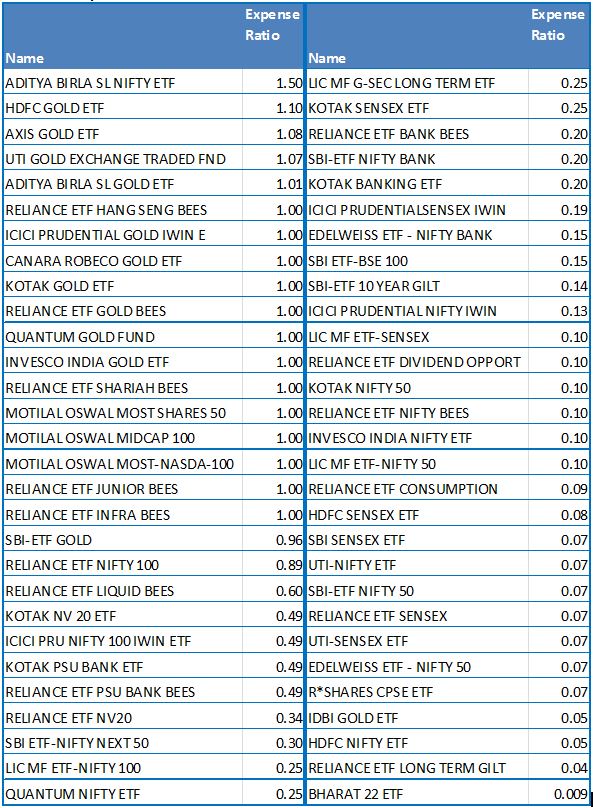
Source: Bloomberg L.P. Data as of Feb. 15, 2018. Table is provided for illustrative purposes.
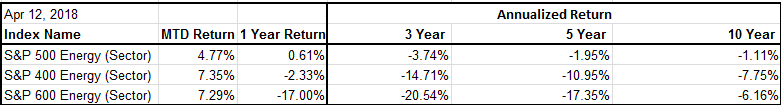
Benchmark Performance Over Active Management
While India is still largely an active-investment space, the dynamics are changing. Our SPIVA® India report has been outlining the same conclusion. Considering the large-cap and mid/small-cap segments as a sample, the shift is evident since 2016, when the outperformance of the benchmark over active funds was significant and continuous in the one-year period. Over the long term (i.e., five and ten years), the outperformance was consistent. A similar outperformance trend was observed in the fixed income segment covered in the India SPIVA reports. This is a good lesson about long-term investment strategy; the empirical evidence suggests that index investing is a good option.
| Exhibit 3: SPIVA India Reports – Percentage of Funds Outperformed by the Index | ||||||
| YEAR | FUND CATEGORY | COMPARISON INDEX | ONE-YEAR (%) | THREE-YEAR (%) | FIVE-YEAR (%) | TEN-YEAR (%) |
| Year-End 2013 | Indian Equity Large-Cap | S&P BSE 100 | 78.53 | 66.67 | 69.23 | – |
| Year-End 2013 | Indian Equity Mid/Small-Cap | S&P BSE MidCap | 21.74 | 35.37 | 42.11 | – |
| Mid-Year 2014 | Indian Equity Large-Cap | S&P BSE 100 | 34.18 | 60.36 | 54.36 | – |
| Mid-Year 2014 | Indian Equity Mid/Small-Cap | S&P BSE MidCap | 44.93 | 32.00 | 38.67 | – |
| Year-End 2014 | Indian Equity Large-Cap | S&P BSE 100 | 23.81 | 57.94 | 52.94 | – |
| Year-End 2014 | Indian Equity Mid-/Small-Cap | S&P BSE MidCap | 10.87 | 22.22 | 35.85 | – |
| Mid-Year 2015 | Indian Equity Large-Cap | S&P BSE 100 | 28.30 | 49.59 | 60.50 | – |
| Mid-Year 2015 | Indian Equity Mid-/Small-Cap | S&P BSE MidCap | 9.09 | 17.39 | 42.86 | – |
| Year-End 2015 | Indian Equity Large-Cap | S&P BSE 100 | 35.79 | 46.79 | 56.52 | – |
| Year-End 2015 | Indian Equity Mid-/Small-Cap | S&P BSE MidCap | 58.14 | 17.78 | 37.93 | – |
| Mid-Year 2016 | Indian Equity Large-Cap | S&P BSE 100 | 53.26 | 39.42 | 58.62 | – |
| Mid-Year 2016 | Indian Equity Mid-/Small-Cap | S&P BSE MidCap | 77.78 | 24.44 | 28.85 | – |
| Year-End 2016 | Indian Equity Large-Cap | S&P BSE 100 | 66.29 | 30.52 | 54.60 | 54.95 |
| Year-End 2016 | Indian Equity Mid-/Small-Cap | S&P BSE MidCap | 71.11 | 48.53 | 42.03 | 46.03 |
| Mid-Year 2017 | Indian Equity Large-Cap | S&P BSE 100 | 52.87 | 34.19 | 50.93 | 58.47 |
| Mid-Year 2017 | Indian Equity Mid-/Small-Cap | S&P BSE MidCap | 56.52 | 43.94 | 37.31 | 50.00 |
| Year-End 2017 | Indian Equity Large-Cap | S&P BSE 100 | 59.30 | 53.00 | 43.40 | 53.54 |
| Year-End 2017 | Indian Equity Mid-/Small-Cap | S&P BSE MidCap | 72.09 | 80.00 | 43.94 | 44.29 |
Source: S&P Dow Jones Indices LLC. Data from the SPIVA India Reports 2013 to 2017. Past performance is no guarantee of future results. Table is provided for illustrative purposes.
Diversification
Index investing offers a select basket of stocks designed by independent providers that are neutral and objective when designing the index. Index providers create indices based on fixed methodologies that cater to the index objective. The skewness of individual stock returns can result in increasing the likelihood of underperformance of an active strategy. In his work on the “efficient market hypothesis,” Eugene Fama “concluded that stock prices follow a random walk, causing analysts to be unable to outperform consistently via fundamental or technical analysis.”2
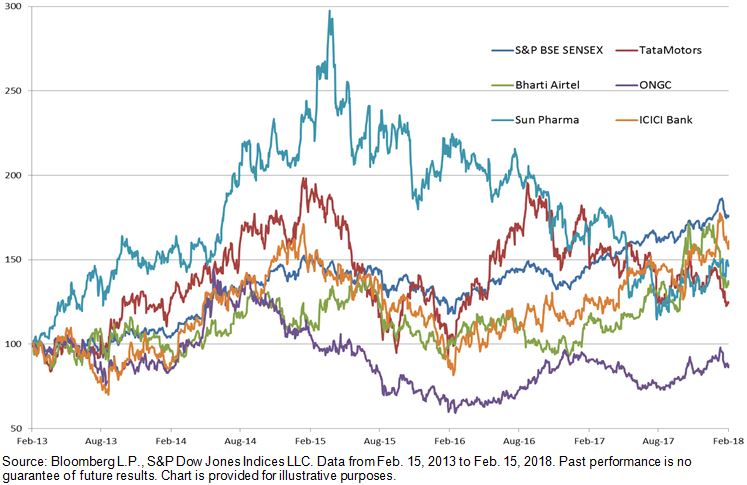
The comparison in Exhibit 4 demonstrates that not only do individual stock strategies tend to be volatile, but over the long term, a consistent approach (such as the S&P BSE SENSEX) can provide consistent returns that, in some cases can be better than individual stock performance.
Exhibit 4. Diversification via Index Versus Individual Stock Approach
Transparency
Index values and information are available publicly. For example, all of the S&P BSE Indices values and methodologies are available at www.asiaindex.co.in. These help to track the index strategy and also to understand historical trends. The traded values of passive structures (such as ETFs) are available on stock exchange websites.
Flexibility
Passive instruments such as ETFs can be traded on the stock exchange and, hence, offer the flexibility of entering and exiting. Therefore, those market participants who are looking for the above characteristics in their investment strategy can opt to include them in their overall portfolios. The debate of active versus passive is always present, but who says one cannot include both to achieve investment goals?
- Mahavir Kaswa, “India ETFs Wrap-up 2017,” Feb. 7, 2018.
- Anu R. Ganti and Craig Lazzara, Shooting the Messenger, December 2017.