Get Indexology® Blog updates via email.

In This List

Evaluating Various Financial Ratios Used in Dividend Analysis

Where May Equities Go From Here?

Considering REIT Lease Durations in a Rising Rate Environment

Laddered Protection

How Much Will My Retirement Income Cost? Part 1

Evaluating Various Financial Ratios Used in Dividend Analysis

Contributor Image
Qing Li

Director, Global Research & Design

S&P Dow Jones Indices

There are many ratios that are used to assess the strength of dividends. In this blog, we explore the commonly used dividend measures in income analysis and their applications. We also introduce cash-flow-based measurements, such as free cash flow yield, that can be combined with traditional dividend measurements to provide additional insight into the quality of dividends.

The most frequently used measure—dividend payout ratio, which is calculated as dividend per share divided by earnings per share—shows what percentage of its profit a company is returning to its shareholders in the form of cash dividends. A low dividend payout ratio means that a company is returning a small portion of its earnings to investors, while a high payout ratio implies that a company uses the majority of its profit for dividends instead of for future growth.

Dividend coverage ratio tells the same story, with the exception that the ratio is calculated as the inverse of dividend payout ratio. Therefore, a low dividend payout ratio and a high dividend coverage ratio have the same indication for the quality of the dividend. Both dividend payout ratio and dividend coverage ratio can be paired up with dividend yield information to help evaluate a company’s dividend payment capabilities. For example, a company with a high dividend yield and low dividend payout ratio (or high dividend coverage ratio) indicates that the company’s dividend yield is supported by its strong earnings.

Consistently increasing dividends is one indication that dividends are supported by a company’s earnings and the firm is confident in its ability to generate profits. That rationale is also the investment thesis behind dividend growth strategies. Dividend growth rate, another important metric in dividend analysis, shows the percentage increase in dividends and can be presented as the product of return on equity (ROE) and earnings retention rate (which is 1 minus payout ratio). The formula shows that dividend growth is influenced by a company’s profitability and dividend payout ratio. A company with a high payout ratio (therefore a low retention rate) may still result in a high dividend growth rate if payouts are supported by high profits (ROE).

While the dividend growth rate helps capture the increases in dividend income, it is often considered an unpredictable factor.[1] [2] In addition, dividend yield, payout ratio, coverage ratio, and growth rate all evaluate dividends with respect to net income, which is an accrual accounting concept. Since the amount of dividends paid is shown on a company’s cash flow statement, another accepted measure is to use cash flow related fundamentals, such as free cash flow yield, to provide additional insight on company’s financial condition.

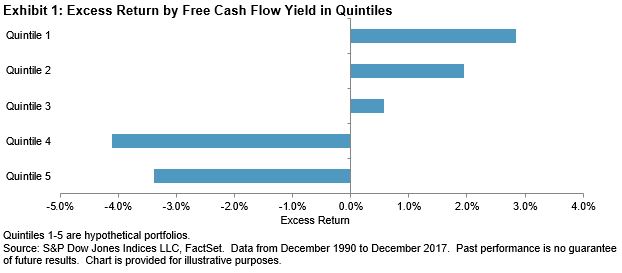
In our recently published research paper (Incorporating Free Cash Flow Yield in Dividend Analysis), we divided the S&P 500 member stocks into quintiles based on free cash flow yield. As of Dec. 31, 2017, the top-quintile stocks generated higher excess return than the remaining quintiles and outperformed the overall market by an average of 2.8% over the previous 27 years (see Exhibit 1).

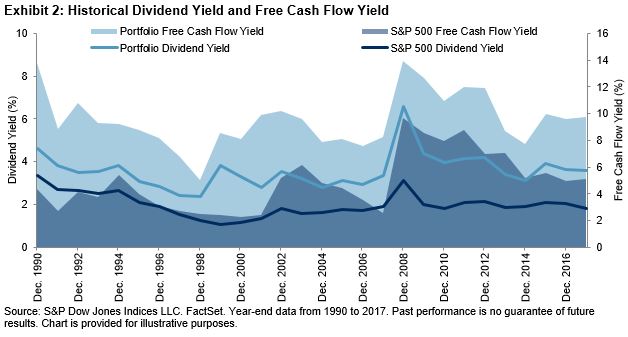
In the paper, we incorporated free cash flow yield into a dividend strategy. Our analysis of a combined dividend and free cash flow yield portfolio[3] showed that a stable dividend income can be achievable when funded by sufficient free cash flow. As displayed in Exhibit 2, the portfolio’s 3.57% average dividend yield was supported by a 9.5% average free cash flow yield, compared with the benchmark’s 1.99% average dividend yield funded by 4.87% average free cash flow yield over the sampled history.

[1]   Cochrane, John H., The Dog That Did Not Bark: A Defense of Return Predictability. 2008.

[2]   Chen, Long, On the reversal of return and dividend growth predictability: A tale of two periods. 2009.

[3]   A hypothetical large-cap portfolio was formed with S&P 500 sector leaders in terms of integrated multi-factor value. The integrated value is the product of dividend yield score and free cash flow yield score, each of which is computed as transforming the standardized fundamental data to cumulative normal distribution, in the range of 0 to 1.

The posts on this blog are opinions, not advice. Please read our Disclaimers.

Where May Equities Go From Here?

Contributor Image
Jodie Gunzberg

Former Managing Director, Head of U.S. Equities

S&P Dow Jones Indices

February ended the longest historical monthly winning streak of 15 months for the S&P 500 (TR) that lost 3.7%.  On a total return basis for the month, 10 of 11 sectors lost, which has only happened in 12 of 342 months or 3.5% of the time (all 11 lost together in 13 months for a total of 25 or 7.3% of months where 10 or 11 lost together.)  Energy lost 10.8%, the most of any sector.  It was the 10th worst month on record for energy since Oct. 1989, and its worst month since Sep. 2011.  Rising inventories and concerns on Chinese demand put pressure on the sector, especially on the smaller companies that may be less hedged.  Only information technology was barely positive, up 0.1%.

Source: S&P Dow Jones Indices

The biggest story in February besides the correction itself may have been volatility  that almost tripled.  The annualized 30-day volatility rose from 8.1% on Jan. 31, 2018 to 22.5% on Feb. 28, 2018, and is the highest since Feb. 19, 2016.  To put it in perspective, the average going back to Feb. 12, 1988 is 15.2% and the volatility has only been greater than 22.5%, the current level, in 12.5% of times.

Source: S&P Dow Jones Indices.  The upper right chart is since Feb. 19, 2016, the last time volatility was as high as on Feb. 28, 2018.

While volatility has increased in many down markets, it may not be a bad thing and can provide some trading opportunities.  However, at this point, there may be some warning signs, particularly from the S&P 500 Bond Index, the corporate bonds of the companies in the S&P 500.  These bonds say a lot about the financial health of the companies in the S&P 500 since the performance (or conversely yields) of the bonds may be dependent on the credit rating and ability of these firms to make payments.  Given rising interest rates generally put pressure on the bonds, and the topic has been concerning for some time now, the S&P 500 Bond Index has already been negative in 4 of the last 6 months.  Perhaps even more importantly, the risk premium as measured by the monthly return of the S&P 500 TR minus the S&P 500 Bond Index was negative (in other words was a discount) back in August 2017 that showed pessimism in the market, despite a positive stock market return.  This is since when bonds outperform stocks it says investors may prefer to hide in the downside protection of the bonds rather than to participate in the upside of the stocks.  Additionally the record high optimism observed in Jan. 2018 could have been taken as a warning signal given the history of stock market performance after discounts follow high premiums.

Source: S&P Dow Jones Indices

And for a closer view of the past 3 years:

Source: S&P Dow Jones Indices

Does that mean one might want to completely sell stocks? Probably not, especially if one believes in long-term growth of the economy.  However, the risk premiums by sector can be one place to look for where to overweight or underweight in addition to other macroeconomic factors.  Right now every sector but information technology is measuring pessimistic, which is the broadest pessimism seen since Aug. 2015 when all sectors showed a discount.  Consumer staples, energy and real estate are showing notably big discounts that while bearish, are not necessarily bearish on the economy yet.  It is clear that the glass is half empty in energy from the inventory and Chinese demand concerns, real estate is one of the worst impacted sectors from rising rates, and consumer staples is basically a defensive play so when there is expected growth, the market may lean towards consumer discretionary.  Financials and information technology are the other two growth sectors to watch before worrying too much.

Source: S&P Dow Jones Indices

Lastly, looking at GDP growth, the dollar, interest rates and inflation, it seems that small-caps and mid-caps are better positioned than large caps now and that energy, materials, information technology and financials are better positioned than real estate, utilities and telecom.


The posts on this blog are opinions, not advice. Please read our Disclaimers.

Considering REIT Lease Durations in a Rising Rate Environment

Contributor Image
John Welling

Director, Global Equity Indices

S&P Dow Jones Indices

U.S. REITS have been lagging broad U.S. equities. During the recent climb in 10-year Treasury yields from the 2018 low of 2.41% on January 2, to as high as 2.94% on February 21, the Dow Jones U.S. Select REIT Index declined 11.2%. Though we have found that REITS have generally fared well over full cycles of rising rates, periods of sharper increases tend to weigh heavily on the minds of REIT investors.

However, REITs with shorter-term lease durations—apartments, hotels/resorts, manufactured homes, and self-storage—have generally fared more favorably. Theoretically, these REITs should be less sensitive to interest rates since they can reprice their rental agreements more quickly. The performance of the Dow Jones U.S. Select Short-Term REIT Index[1] illustrates this concept well, falling a lesser 9.3% over the same period, while its counterpart, the Dow Jones U.S. Select Long-Term REIT Index, fell 12.3% (see Exhibit 1).

If we expand the data to include the full run of the two most recent spikes in rates, we see that the Dow Jones U.S. Select Short-Term REIT Index has outperformed benchmark REIT indices. The performance of the Dow Jones U.S. Select REIT Index has been somewhat insulated by its exclusion of net-lease REITs, which tend to have relatively high sensitivity to interest rates. For this reason, we have also included the S&P U.S. REIT, which includes net-lease REITs as an added comparison (see Exhibit 2).

The Dow Jones U.S. Select Short-Term REIT Index has significantly outperformed the broader REIT market over the long run, with modestly lower volatility. This effect seems to be a byproduct of the index’s less-severe drawdowns during periods of rapidly rising rates.

It may be a good time for REIT investors to consider the duration of their REIT holdings. The Dow Jones U.S. Select Short-Term REIT Index may offer beneficial risk/return characteristics when compared to benchmark REIT indices, particularly during periods of rapidly rising rates.

[1]   https://spindices.com/documents/education/talking-points-dj-us-short-term-reits.pdf

The posts on this blog are opinions, not advice. Please read our Disclaimers.

Laddered Protection

Contributor Image
Kevin Horan

Former Director, Fixed Income Indices

S&P Dow Jones Indices

Continuing the theme of rising interest rates and following up from my last blog, “With all the News of Higher Interest Rates, Don’t Forget About Floating-Rate Debt,” bond laddering is a strategy that provides increased income and the ability to adjust the stream of income in a rising-interest-rate environment. The approach is to invest in specific maturity dates, or “rungs” of the ladder. For example, if you wanted to create a bond ladder today, you could buy bonds maturing in 2019, 2020, 2021, and so forth. The products used for such a strategy can vary, but are usually U.S. Treasury bonds, U.S. Municipal bonds, or corporate bonds.

S&P Dow Jones Indices has published many articles that address this topic. The educational paper, “Laddering a Portfolio of Municipal Bonds,” is a detailed piece that covers the construction and benefits of this kind of strategy.

To many people, the most important part of creating a bond ladder designed to preserve capital and build wealth in a rising-rate environment is buying individual bonds or defined-maturity ETFs.

However, it’s possible to keep a bond ladder intact by reinvesting that cash into a new longer-dated instrument. By rolling the proceeds into a longer-dated instrument, every time a shorter one matures, it’s possible to create a reliable income stream that may rise with interest rates over time.

Indices can be a helpful way to study the performance of a ladder strategy and the income producing result of the strategy in an increasing interest rate environment. In some cases, the index may have an investable ETF or ETP product issued against it, which gives an investors access to that segment of the market.

The indices in Exhibit 1 have been designed for use in laddering strategies.

Exhibit 1: Indices Designed for Laddering Strategies (Total Returns)

Source: S&P Dow Jones Indices LLC. Data as of Feb. 28, 2018. Chart is provided for illustrative purposes.

 For more information, please see these additional laddering articles:

Navigating Rising Rates: Municipal Bond Ladders by Matt Tucker

The Tactical Case for Bond Ladder ETFs by Matthew Forester

Fixed Income Laddering by Kevin Horan

Advisors Managing Interest Rate Risk With Municipal Bond Indices and ETFS by Shaun Wurzbach

Applying a Laddering Strategy to Preferred Portfolios in Canada by Phillip Brzenk


The posts on this blog are opinions, not advice. Please read our Disclaimers.

How Much Will My Retirement Income Cost? Part 1

Contributor Image
Wes Crill

Vice President, Research

Dimensional Fund Advisors

Gaining clarity around the future spending, or consumption, that an investor’s savings can support is critical in planning for retirement. Being armed with information about retirement preparedness can inform one’s decisions about savings rate, expense budget in retirement, and investment selections. A first step towards solving this challenge is to understand how much retirement income costs.

One way to visualize retirement income is as a string of cash flows that fund a retiree’s consumption—the “retirement income liability”. The objective for investors is to fund these cash flows from current and future savings. Each of these cash flows has a price that is known from today’s bond yield curve. For example, the interest rate on a 10-year zero coupon US Treasury bond can be used to infer the present value[i] of a cash flow 10 years from now.

This framework suggests two primary risks that increase uncertainty about the degree to which current savings can support the retirement income liability. First, since the present value of future cash flows depends on interest rates, the cost of the liability is sensitive to interest rate changes. For example, if interest rates go up, the liability cost will go down, and vice versa. In addition, retirement consumption is likely to be in goods and services that rise in cost with inflation. Higher inflation means today’s savings do not have the same purchasing power in the future.

The S&P Shift To Retirement Income and Decumulation (STRIDE) Index Series can help cut through the fog of uncertainty.[ii] STRIDE Indices define a retirement income goal of $1 of inflation-adjusted income for 25 years, i.e., the Generalized Retirement Income Liability or “GRIL.” This definition assumes an average life expectancy of 20 years, beginning at age 65, plus a five-year buffer to account for uncertainty about life expectancy. Using real interest rates taken from available Treasury Inflation-Protected Securities (TIPS), S&P discounts each future $1 and adds them up to compute the present value of the GRIL, as shown in Exhibit 1.

Chart is provided for illustrative purposes. Assumes that the first dollar of income is received at the end of the first year of retirement. Present value calculation assumes a hypothetical discount rate[iii] of 2%.

With this number, we can meaningfully translate a retirement account balance into expected future consumption. Dividing the current balance by the cost of income (the GRIL) provides an estimated annual income stream in retirement. This number is equivalent to the value, in real terms, that can sustainably be withdrawn each year for consumption during the retirement period.

These insights can help inform what an investment solution should look like. An investment solution integrated with the goal of retirement income should focus on reducing volatility in the ratio of account balance to cost of income, which reduces uncertainty in the income estimate. To learn more about how the S&P STRIDE Index Series incorporates a retirement income focus into its design, tune in for part 2 tomorrow.

Important Information

In response to the need for income-focused benchmarks within defined contribution plans, on January 11, 2016 S&P Dow Jones Indices (S&P DJI) launched the S&P Shift to Retirement Income and DEcumulation (STRIDE) Index Series.

The series features multi-asset class income-based indices tied to target retirement dates. Dimensional Fund Advisors worked collaboratively with S&P DJI to develop the glide path, inflation hedging, and duration hedging techniques used in these indices.

Disclosures

The S&P STRIDE INDEX is a product of S&P Dow Jones Indices LLC or its affiliates (“SPDJI”) and has been licensed for use by Dimensional Fund Advisors LP (“Dimensional”). Standard & Poor’s® and S&P® are registered trademarks of Standard & Poor’s Financial Services LLC (“S&P”); Dow Jones® is a registered trademark of Dow Jones Trademark Holdings LLC (“Dow Jones”); these trademarks have been licensed for use by SPDJI and sublicensed for certain purposes by Dimensional. Dimensional’s products, as defined by Dimensional from time to time, are not sponsored, endorsed, sold, or promoted by SPDJI, S&P, Dow Jones, or their respective affiliates, and none of such parties make any representation regarding the advisability of investing in such products nor do they have any liability for any errors, omissions, or interruptions of the S&P STRIDE Index.

Dimensional Fund Advisors LP receives compensation from S&P Dow Jones Indices in connection with licensing rights to the S&P STRIDE Indices. It is not possible to invest in an index.

Dimensional Fund Advisors LP is an investment advisor registered with the Securities and Exchange Commission.

[i] A ”present value” is how much a future sum of money is worth today.

[ii] To learn more about the S&P STRIDE Index Series, see S&P STRIDE Index Series Methodology, available at us.spindices.com.

[iii] A discount rate is the rate used to transform future cash flows into today’s dollars.

The posts on this blog are opinions, not advice. Please read our Disclaimers.