For investors, things looked very different between the end of January and the first part of February. Following a few days of market turmoil in February, volatility jumped to levels where it is once again at the forefront of investors’ consciousness. Volatility based on a 252-day lookback generally declined for S&P 500 sectors (Telecom excluded) through January 31 compared to three months prior.
252-Day Volatility Declined Across All S&P 500 Sectors Except Telecom Through January 31, 2018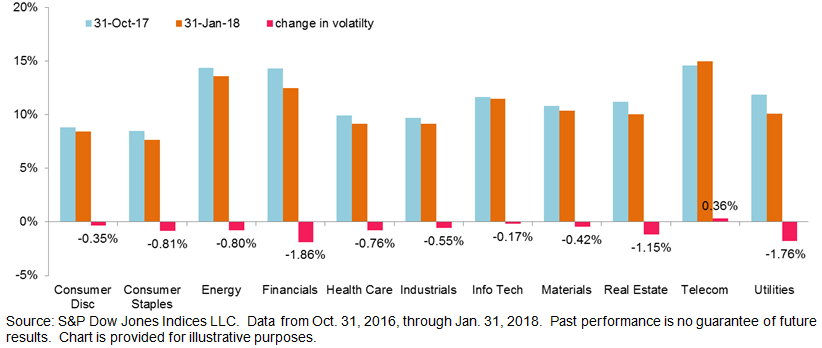
Fast forward a little more than a week later and we see a very different picture. The same metric through February 9 shows that volatility has increased for all S&P 500 sectors, and by generally similar amounts.
252-Day Volatility Jumped Across All S&P 500 Sectors Through February 9, 2018 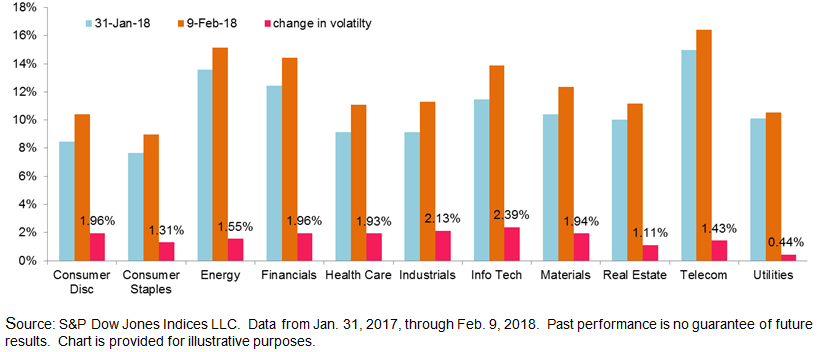
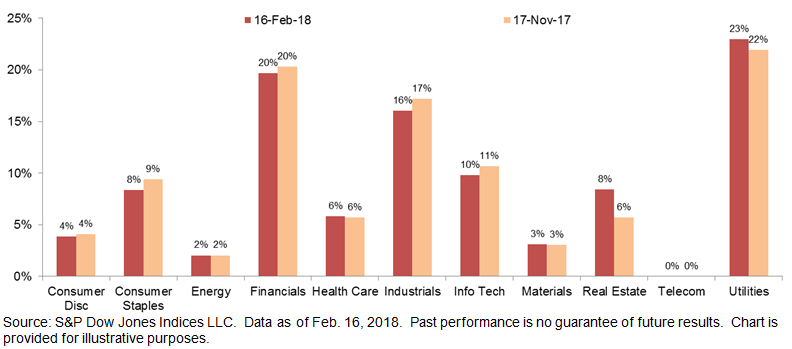
These two charts provide some context around the latest rebalance for the S&P 500® Low Volatility Index, which tracks the 100 least volatile stocks in the S&P 500. Given recent market turbulence, one might be surprised to find that the latest rebalance has not shifted the composition much in terms of sector allocation within the S&P 500 Low Volatility Index. The biggest change (effective at the close today) was a 2% shift to Real Estate. Weight changes in other sectors were negligible.
The index methodology calls for the rebalance to take place on the third Friday of every third month (February, May, August and November); the reference date (the date from which we measure historical volatility) is the last trading day of the month prior. In this case, constituents’ volatility was measured as of January 31, before the recent spike in market volatility occurred. February’s volatility spike, along with whatever else happens between now and April 30, will help drive the next rebalance. It will be interesting to see what the next two and a half months bring.
Latest Rebalance for the S&P 500 Low Volatility Index