The investment community routinely uses historical realized volatility as an indicator of future volatility. One prominent example of this is the construction of ranking-based, low volatility equity strategies where realized volatility is used to form low volatility portfolios. Can the realized volatility of an asset indicate its future volatility? We extend the low volatility analysis to U.S. preferred stocks to see if the low volatility effect is present in other asset classes. For our analysis, the S&P U.S. Preferred Stock Index is used to represent the investment universe of U.S. preferred stocks.
To construct a low volatility factor portfolio, it is common to select securities that had low realized volatility over a pre-specified period and hold the portfolio for the subsequent n months. Accordingly, in our analysis, we measure the relationship between the realized volatility over the previous one-year period and that of the subsequent three months across all preferred securities in the universe for each quarterly rebalance date.
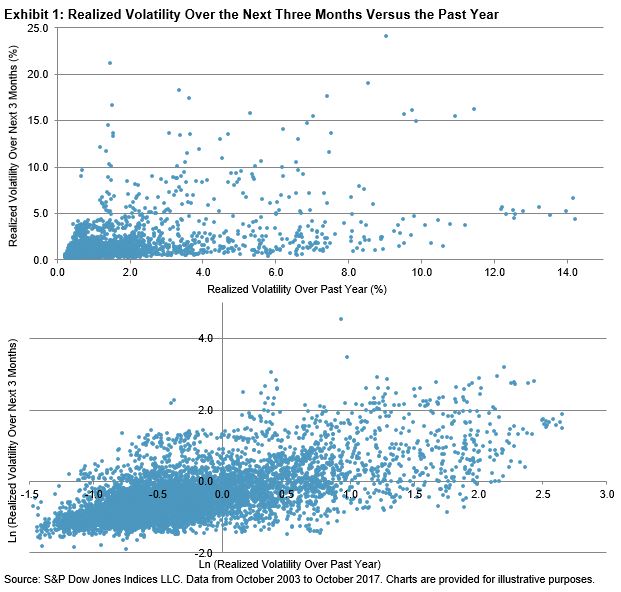
Exhibit 1 shows the volatility for the next three months versus the realized volatility for the past year in scatter plots. The top plot shows a positive relationship between these two sets of realized volatility. Moreover, the relationship seems to be exponentially related, rather than linearly. The bottom graph plots the two sets of volatility in natural logarithm terms and shows a more linear relationship than the top plot.
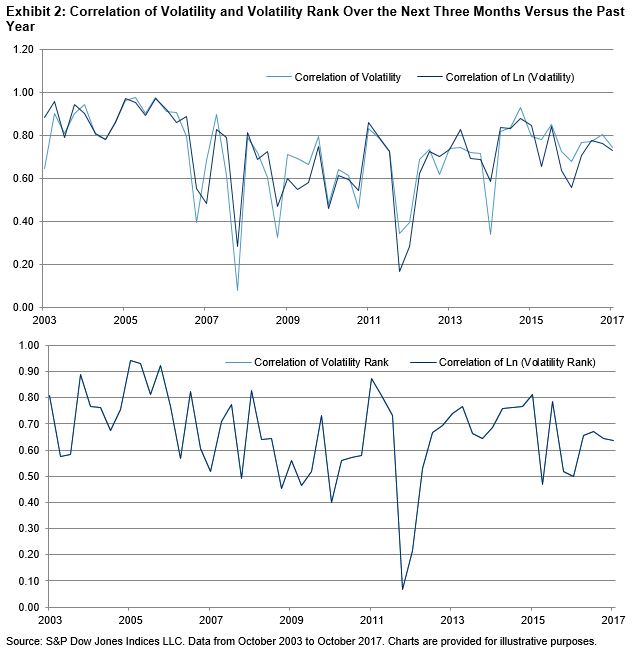
In Exhibit 2, we show the rolling correlation, where at each time point the correlation is calculated between the realized volatility over the past year and the realized volatility over the next three months for all the preferred stocks in the universe as of each quarterly rebalance date. Since low volatility factor portfolios typically select securities using volatility rank, we also calculated the correlation of volatility ranks based on these two sets of realized volatility.
The top panel shows that the correlation of the logarithmic volatilities seems to be more stable than that of the volatilities themselves for each point in time. The bottom panel shows that the correlation of volatility rank and the logarithmic volatility rank are identical. Since October 2003, the average correlation of the rank of the two sets of volatility is 0.66.
The analysis shows that, on average, a preferred stock that ranks low or high based on its realized volatility over the past year is likely to continue to rank low or high for the volatility exhibited in the next three months. This lends support to arguments for using realized volatility to construct a low volatility factor portfolio for preferred stocks.