In recent years, socially responsible investing has gained importance among market participants worldwide. Globally, there has been an increase in the number of large-scale market participants who have become socially conscious and want to allocate their investments toward businesses that acknowledge the relevance of environmental, social, and governance (ESG) factors.
Socially responsible investing in India is at a nascent stage, but it is evolving and is expected to gain momentum in coming years. Many stakeholders, including governments, corporations, and market participants, have become more conscious of this concept and are looking to integrate ESG aspects of businesses in their mainstream investment strategies.
In India, S&P BSE Indices has three indices in the sustainability space.
- S&P BSE 100 ESG Index: This index is designed to measure securities that meet sustainability investing criteria on ESG aspects while maintaining a risk and performance profile similar to the S&P BSE 100.
- S&P BSE CARBONEX: This index is designed to measure performance of the companies within the S&P BSE 100 based on their commitment to mitigating risks arising from climate change.
- S&P BSE GREENEX: This index is designed to measure the performance of the top 25 “green” companies in the S&P BSE 100 in terms of greenhouse gas emissions.
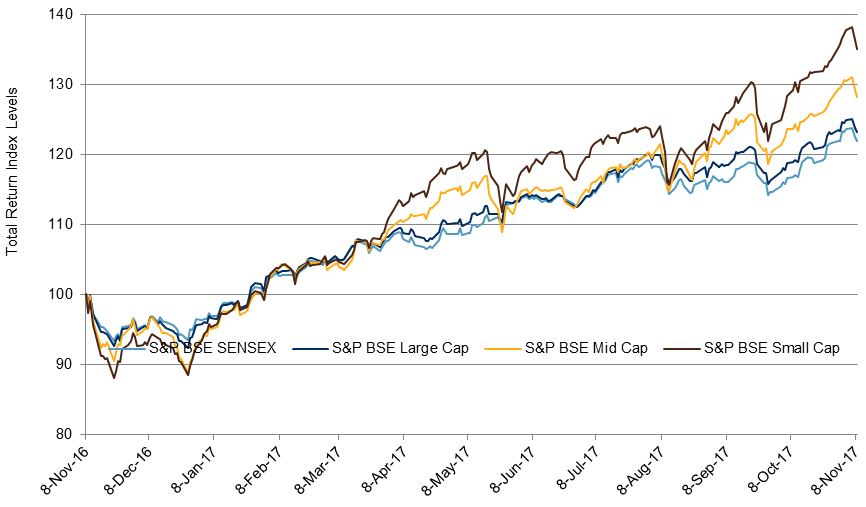
Exhibits 1 and 2 showcase the three-year performance returns and the risk/return profiles of the three previously mentioned indices and compare them with the S&P BSE 100, which is the benchmark for the three sustainability indices, and the S&P BSE SENSEX, which is India’s headline index.
Exhibit 1: Performance of the S&P BSE 100 ESG Index, S&P BSE CARBONEX, S&P BSE GREENEX, S&P BSE 100, and S&P BSE SENSEX
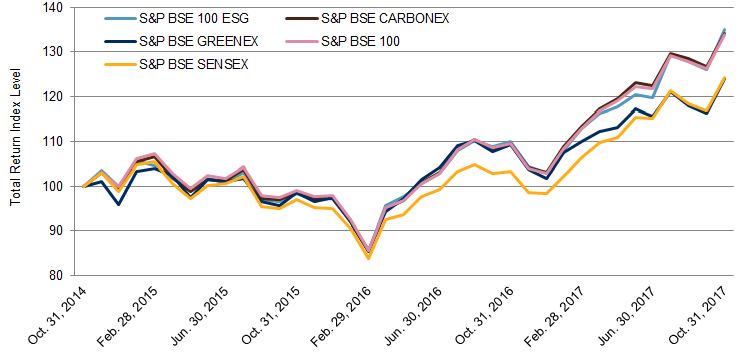
Source: S&P Dow Jones Indices LLC. Data from Oct. 31, 2014, to Oct. 31, 2017. Index performance is based on total return in INR. Past performance is no guarantee of future results. Chart is provided for illustrative purposes and reflects hypothetical historical performance. The S&P BSE 100 ESG Index was launched on Oct. 26, 2017.
| Exhibit 2: Risk/Return Characteristics of the S&P BSE 100 ESG, S&P BSE CARBONEX, S&P BSE GREENEX, S&P BSE 100, and S&P BSE SENSEX | ||||||
| YEAR | S&P BSE 100 ESG INDEX | S&P BSE CARBONEX | S&P BSE GREENEX | S&P BSE 100 | S&P BSE SENSEX | |
| ABSOLUTE RETURN (%) | ||||||
| 3-Year | 34.89 | 34.03 | 23.99 | 33.83 | 24.28 | |
| ANNUALIZED RETURN (CAGR) (%) | ||||||
| 1-Year | 22.55 | 22.44 | 13.44 | 22.32 | 20.47 | |
| 2-Year | 17.08 | 16.60 | 12.12 | 16.25 | 13.17 | |
| 3-Year | 10.49 | 10.25 | 7.43 | 10.20 | 7.51 | |
| RISK (%) | ||||||
| 1-Year | 13.55 | 11.95 | 12.76 | 12.15 | 11.67 | |
| 2-Year | 14.97 | 14.33 | 14.27 | 14.37 | 13.80 | |
| 3-Year | 13.95 | 13.75 | 13.87 | 13.80 | 13.53 | |
| RISK-ADJUSTED RETURN | ||||||
| 1-Year | 1.66 | 1.88 | 1.05 | 1.84 | 1.75 | |
| 2-Year | 1.14 | 1.16 | 0.85 | 1.13 | 0.95 | |
| 3-Year | 0.75 | 0.75 | 0.54 | 0.74 | 0.56 | |
Source: S&P Dow Jones Indices LLC. Data from Oct. 31, 2014 to Oct. 31, 2017. Past performance is no guarantee of future results. Table is provided for illustrative purposes and reflects hypothetical historical performance. The S&P BSE 100 ESG Index was launched on Oct. 26, 2017.
From Exhibits 1 and 2, we can see that the S&P BSE 100 ESG and S&P BSE CARBONEX outperformed the S&P BSE SENSEX and S&P BSE 100 over the period studied. The three-year absolute return of the S&P BSE 100 ESG and S&P BSE CARBONEX was 34.89% and 34.03%, respectively, while that of the S&P BSE SENSEX and S&P BSE 100 was 24.28% and 33.83%, respectively.
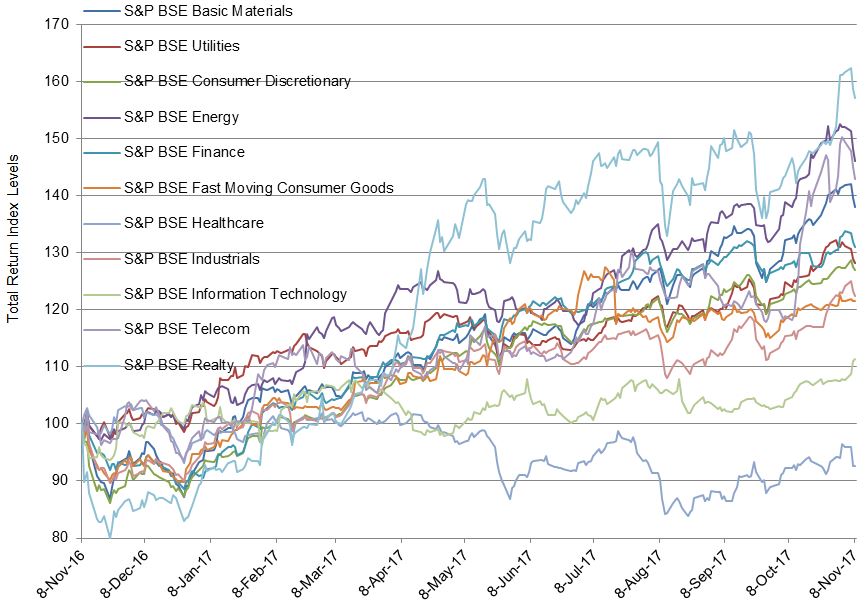
The three sustainability indices cover all of the 11 GICS® sectors. Exhibit 3 lists the sector breakdown with weightages of the three sustainability indices.
Exhibit 3: Sector Breakdown of the S&P BSE 100 ESG Index, S&P BSE CARBONEX, and S&P BSE GREENEX

Source: S&P Dow Jones Indices LLC. Data from Oct. 31, 2014, to Oct. 31, 2017. Past performance is no guarantee of future results. Chart is provided for illustrative purposes and reflects hypothetical historical performance. The S&P BSE 100 ESG Index was launched on Oct. 26, 2017.
We can see that the financials sector had the highest weight in the three indices, while real estate had the lowest weight (see Exhibit 3).
Socially responsible investing in India is slowly but surely gaining importance, as there has been a paradigm shift in the investment strategy adopted by market participants. Market participants have now started to give importance to ESG aspects while assessing companies’ long-term strategy for wealth creation. Many market participants now believe that the long-term financial sustainability and value creation of a company is dependent on how a company manages its ESG aspects in the long run.
The posts on this blog are opinions, not advice. Please read our Disclaimers.