As noted in a previous blog, The Trump Rally – One Year Later, the Domestic Revenue Portfolio underperformed the foreign revenue portfolio during the one-year period since the 2016 U.S election. We showed that currency movements may have negatively impacted the performance of the Domestic Revenue Portfolio.
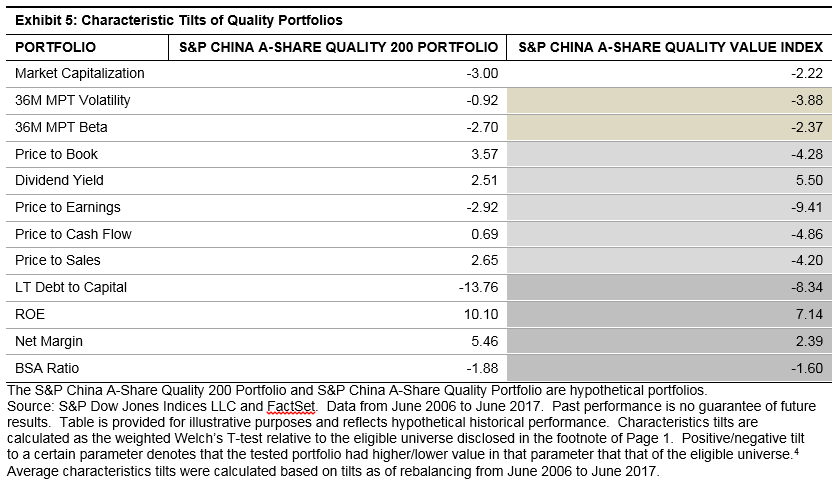
To better understand the currency risk of the portfolios beyond tracking relative performance and currency movements, we use the Northfield U.S. Macroeconomic Equity Risk Model to breakdown total portfolio risk. This model gives us the ability to understand the macroeconomic risk exposures, including changes in the value of the U.S. dollar, of a portfolio. Exhibit 1 breaks down the total risk (in variance terms) of the two portfolios between stock specific risk and systematic/factor risk.
The Foreign Revenue Portfolio had significantly higher stock specific risk than the Domestic Revenue Portfolio, which means the percentage of total risk that can be explained by U.S. macroeconomic factors present in the model is lower.
The highlighted factor in Exhibit 1, Exchange Rate USD, indicates how much of the total risk is caused by changes in USD value relative to other major trade currencies. We can see that the currency risk of the Foreign Revenue Portfolio (7.58%) was much higher than the Domestic Revenue Portfolio (1.26%), which indicates that changes in USD will have a higher impact on the foreign portfolio than the domestic portfolio. In other words, the Foreign Revenue Portfolio is more sensitive to weakening and strengthening of the U.S. dollar than the Domestic Portfolio.
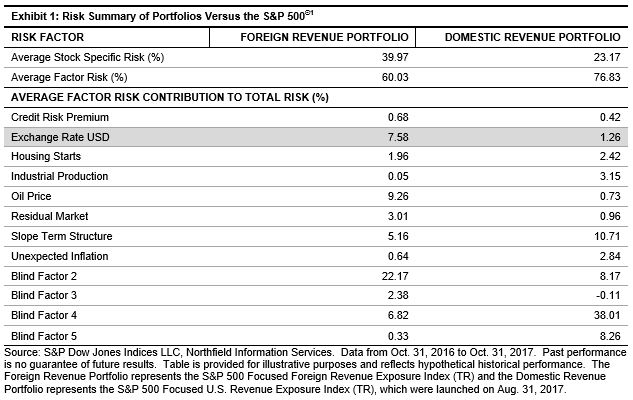
As such, we look at the factor exposures and how those exposures in turn have affected the portfolios. These figures show how the individual factors have performed over the 12-month period, as well as if the active factor exposures of the portfolios have contributed positively, or negatively, to total return.
For the 12-month period, the average monthly return for the Exchange Rate USD factor was -0.44%, meaning that holding the U.S. dollar versus holding other major trade currencies would negatively contribute to total return. Relative to the S&P 500, the Foreign Revenue Portfolio is observed to have negative active exposure to the currency factor, while the Domestic Portfolio has positive active exposure. The active exposures of the portfolios show that relative to the S&P 500, 1) the foreign portfolio is negatively related to changes in the USD value, and 2) the domestic portfolio is positively related to the USD value. These results confirm the potential relationship we saw in the previous blog post. The compounded factor impact shows the result of the active portfolio exposures to total return.
In a forthcoming blog, we will look beyond macroeconomic risk to sector-level performance attribution analysis of the portfolios.
[1] The model provides a monthly-based analysis; therefore the start date is Oct. 31, 2016, as opposed to Nov. 8, 2016.
[2] The model provides a monthly-based analysis; therefore the start date is Oct. 31, 2016, as opposed to Nov. 8, 2016.
The posts on this blog are opinions, not advice. Please read our Disclaimers.