Quality investing has been one of the most widely accepted investment philosophies. The attractiveness of quality stocks stems from their defensive nature under distressed market conditions. In China’s A-Share market, quality stocks have gained renewed attraction in 2017. In the first nine months of 2017, the quality portfolio outperformed the other factor portfolios in absolute terms (see Exhibit 1).
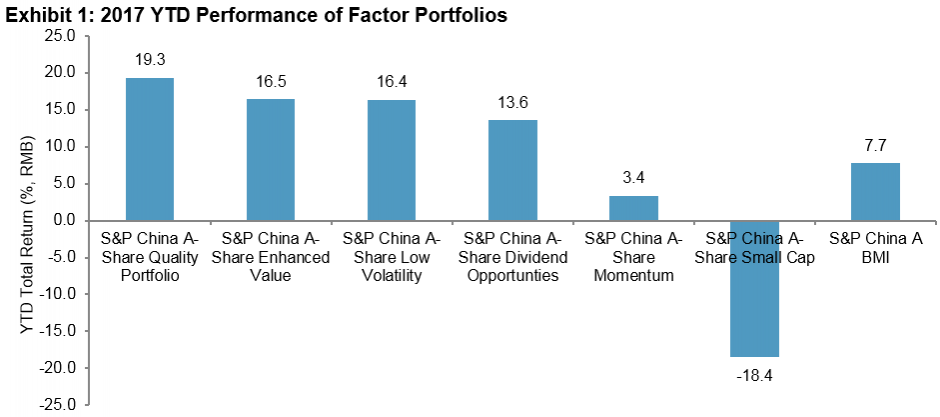
The S&P Access China A-Share Dividend Opportunities was launched on Sept. 11, 2008.[1] All other portfolios are hypothetical portfolios based on the same starting universe.[2] The top 100 stocks with the highest factor scores in the eligible universe are selected, subject to a 20% rebalance buffer by number of stocks, following the corresponding standard S&P DJI methodologies.[3]
Source: S&P Dow Jones Indices LLC. Data from Dec. 31, 2016, to Sept. 29, 2017. Index performance based on total return in RMB. Past performance is no guarantee of future results. Chart is provided for illustrative purposes and reflects hypothetical historical performance.
As the prices of quality stocks rise, the risk of paying too much for good quality stocks may become a concern for market participants. As of Sept. 29, 2017, compared to the respective eligible universe, the S&P China A-Share Quality Portfolio exhibited strong tilts toward quality features (high profit margin, low financial leverage, and low accrual ratio) and defensive features (low beta and low volatility) as expected. However, it also exhibited unintended tilts toward more expensive valuations (higher price-to-book and high price-to-sales ratios).
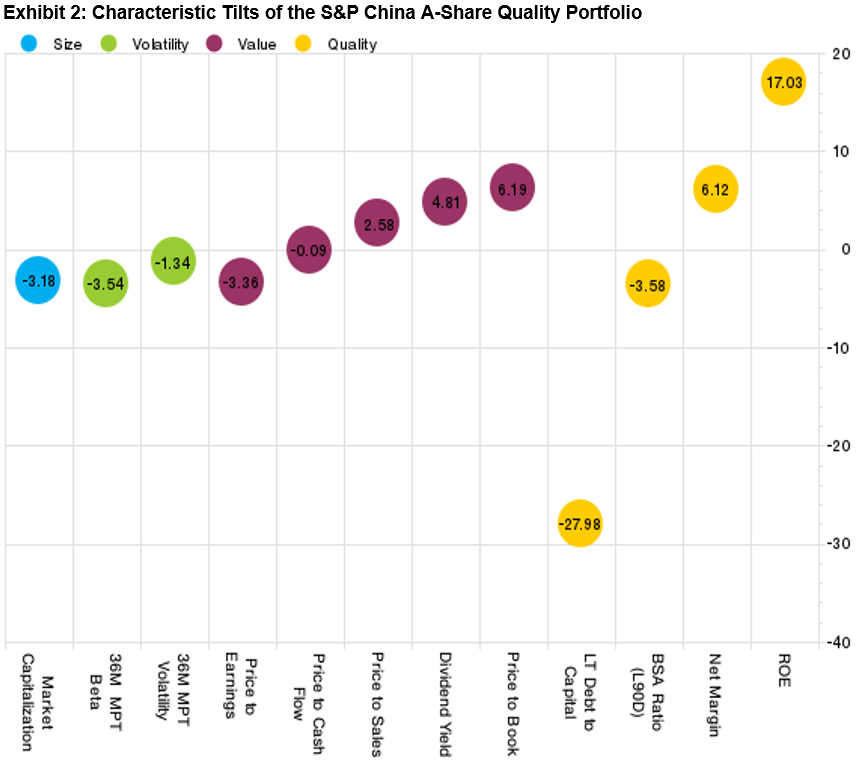
The S&P China A-Share Quality Portfolio is a hypothetical portfolio.
Source: S&P Dow Jones Indices LLC and Factset. Data as of Sept. 29, 2017. Chart is provided for illustrative purposes and reflects hypothetical historical performance. Characteristic tilts are calculated as the weighted Welch’s T-test relative to the eligible universe disclosed in footnote 3. Positive/negative tilt to a certain parameter denotes that the S&P China A-Share Quality Portfolio had higher/lower value in that parameter than of the eligible universe.[4]
Exhibit 3 further extended the analysis on the historical valuation of the S&P China A-Share Quality Portfolio. As we can see, quality stocks have been relatively expensive not just recently, but consistently in the history. From June 2006 to September 2017, the S&P China A-Share Quality Portfolio tended to have relatively higher price-to-fundamental ratios, especially price-to-book, price-to-sales, and price-to-cash flow ratios, than its corresponding eligible universe.
To avoid buying into overvalued high-quality stocks, a natural approach would be to apply a secondary value screen on the quality portfolio to exclude relatively expensive quality stocks.
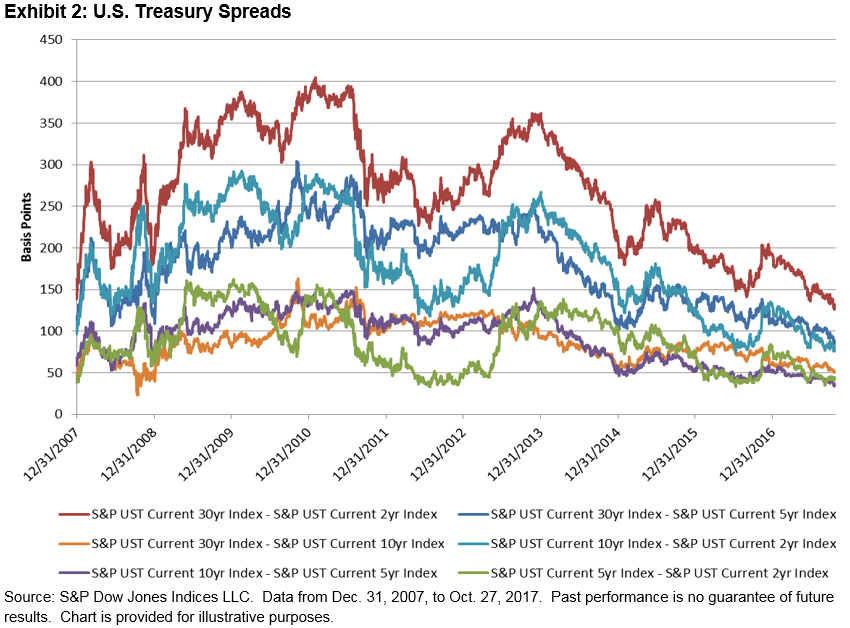
Based on what we have observed in other markets,[5] value portfolios and quality portfolios tend to have low correlation in performance and tend to exhibit distinct cyclicality. We found that in China’s A-share market, that the rolling 250-day correlation between the excess returns of the quality portfolio and value portfolio over the 10-year period were fairly low, most of the time in negative domain, which suggests the potential diversification benefits for combining these two factors in portfolio construction (see Exhibit 4).
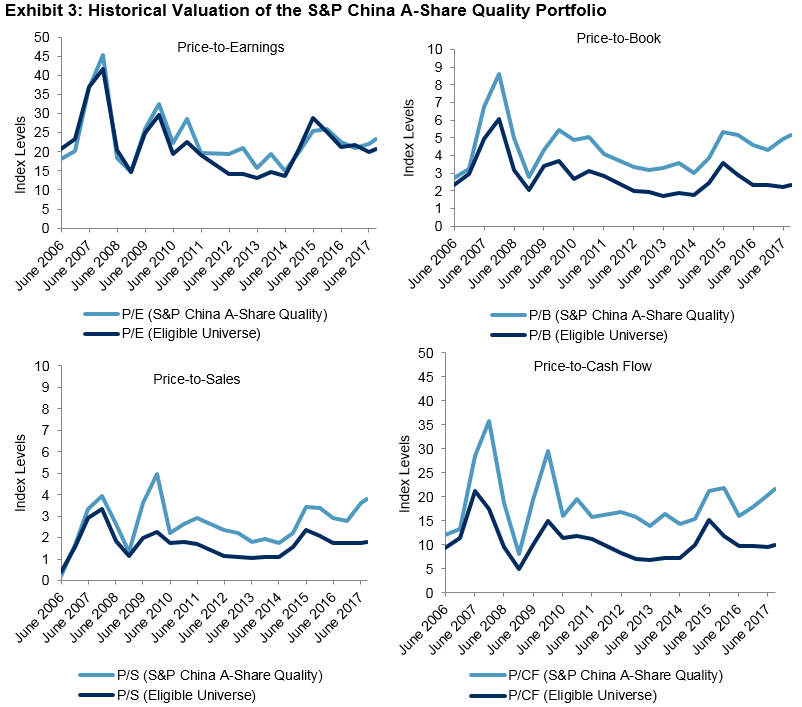
The S&P China A-Share Quality Portfolio is a hypothetical portfolio.
Source: S&P Dow Jones Indices LLC and Factset. Data as of the end of June and December each year from 2006 and 2017, as well as Sept. 29, 2017. Charts are provided for illustrative purposes and reflects hypothetical historical performance.
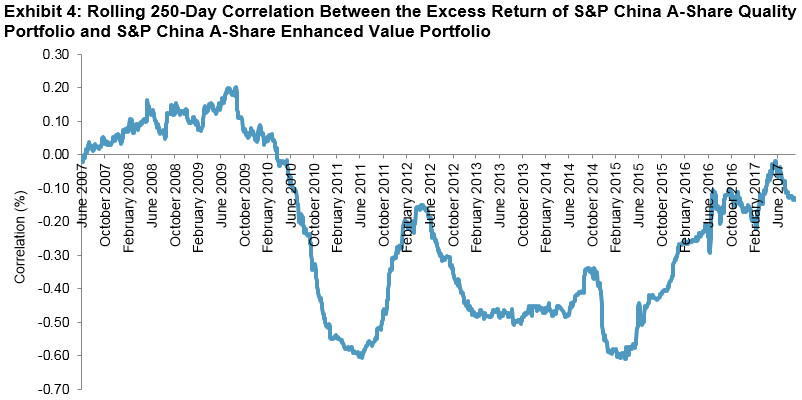
S&P China A-Share Quality Portfolio and S&P China A-Share Enhanced Value Portfolio are hypothetical portfolios.
Source: S&P Dow Jones Indices LLC. Correlation was calculated based on the daily excess returns in RMB relative to the S&P China A BMI from June 30, 2007, to Sept. 29, 2017. Past performance is no guarantee of future results. Chart is provided for illustrative purposes and reflects hypothetical historical performance.
[1] For detailed index methodology, please see https://asia.spindices.com/indices/strategy/sp-china-a-share-dividend-opportunities-index-chinese-renminbi .
[2] Constituents were drawn from the combined universe of the S&P China A BMI and the S&P China A Venture Enterprise Index. Eligible stocks must have a float-adjusted market cap no less than RMB 1 billion and three-month average daily value traded no less than RMB 20 million. For factor portfolios except for small cap, a 10% buffer was applied on the size and liquidity thresholds that favor existing constituents.
[3] Size is measured by a float-adjusted market cap. Value is measured as the average z score of earnings-to-price, sales-to-price, and book value-to-price ratios. Volatility is measured as the one-year realized price return volatility. Momentum is measured by the z score of six-month risk-adjusted momentum, calculated as the price return over the past six months (excluding the most recent month) divided by the standard deviation of daily price returns during the same period. Quality is measured as the average z score of balance sheet accrual ratio (BSA ratio), financial leverage and ROE. Constituents of value, momentum, and quality portfolios are weighted by score-tilted market cap, subject to security and sector constraints such that the weight of each security is between 0.05% and the lower of 5% and 20 times its float-adjusted market-cap weight in the starting universe, and the maximum weight of any given GICS sector is 40%. The small-cap and low-volatility portfolios are weighted by a float-adjusted market cap and inverse of volatility, respectively, without any security or sector constraints. The low-volatility portfolios are rebalanced quarterly effective on the third Friday in March, June, September, and December. The rest of the factor portfolios were rebalanced semiannually, effective on the third Friday in June and December.
[4] Positive tilt to market capitalization denotes the tested portfolio had a large-cap bias compared to the benchmark. Positive tilt to beta or volatility denotes the tested portfolio was less defensive. Positive tilt to the price-to-fundamental ratio means the tested portfolio was more expensive than the benchmark. Positive tilt to LT debt to capital and BSA ratio means companies in the tested portfolio had higher financial leverage and poorer earning quality, respectively. Positive tilt to net margin or ROE means companies in the tested portfolio were more profitable.
[5] Ung, Daniel and Luk, Priscilla (2016). “What Is in Your Smart Beta Portfolio? A Fundamental and Macroeconomic Analysis.” S&P Dow Jones Indices. Zeng, Liyu and Luk, Priscilla (2017). “How Smart Beta Strategies Work in the Hong Kong Market” S&P Dow Jones Indices.
The posts on this blog are opinions, not advice. Please read our Disclaimers.