On May 16, 2014, Lok Sabha election results were announced and India gave a clear mandate to Narendra Modi’s Bharatiya Janata Party to form the government. Narendra Modi was sworn in as the 14th Prime Minister of India on May 26, 2014, and his government recently completed three years of being in power. In these three years, the government has made several landmark policy decisions, initiatives that have the potential to affect the Indian economy in a big way. Some of these initiatives are listed below.
- GST – The Goods and Services Tax is the biggest tax reform since independence.
- Make in India – Aimed at making India a global manufacturing hub.
- Demonetization – Aimed at cracking down on black money.
- Skill India – Aimed at providing skill development training to youth.
- Digital India – Aimed at digitizing India and moving to cashless transactions.
- Start-up India – Aimed at promoting entrepreneurship.
- Jan-Dhan Yojana – Aimed at bringing banking services to every household in India.
Capital Market Performances Over the Past Three Years
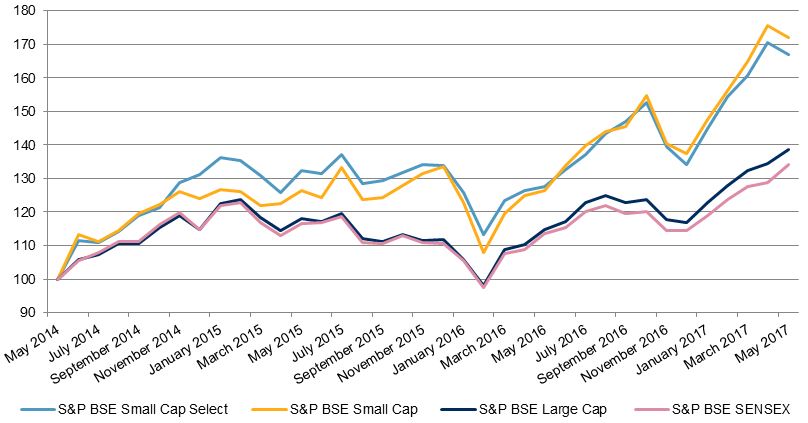
The S&P BSE SENSEX (TR) value moved from 32,735.68 on May 31, 2014, to 43,944.23 on May 31, 2017; that is a three-year absolute return of 34.24%. The price return version of the S&P BSE SENSEX closed above the 30,000 mark for the first time on April 26, 2017, at 31,145.80. The S&P BSE AllCap, a broad benchmark index with over 900 constituents, had a three-year absolute return of 49.90%; Exhibit 1 depicts the total returns of the S&P BSE SENSEX and S&P BSE AllCap for the three-year period ending May 31, 2017.
Exhibit 1: Total Returns of the S&P BSE SENSEX and S&P BSE AllCap

Source: S&P Dow Jones Indices LLC. Data from May 31, 2014, to May 31, 2017. Chart is provided for illustrative purposes. Past performance is no guarantee of future results.
Among the size indices, the three-year absolute return of the S&P BSE MidCap was the highest, at 79.52%, followed by the S&P BSE SmallCap, at 72.11%, while the S&P BSE LargeCap was at 38.56%. Exhibit 2 depicts the total returns of the S&P BSE LargeCap, S&P BSE MidCap, and S&P BSE SmallCap for the three-year period ending May 31, 2017.
Exhibit 2: Total Returns of the S&P BSE Size Indices
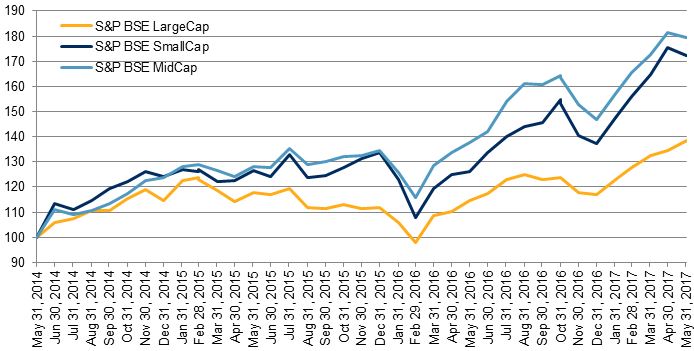
Source: S&P Dow Jones Indices LLC. Data from May 31, 2014, to May 31, 2017. Chart is provided for illustrative purposes. Past performance is no guarantee of future results.
Exhibit 3 below provides the three-year absolute returns of the S&P BSE AllCap series. We can see that among the sub-sector indices in the S&P BSE AllCap, the S&P BSE Consumer Discretionary Goods and Services and the S&P BSE Finance posted the best three-year absolute returns of 86.99% and 68.45%, respectively, while the S&P BSE Telecom had the worst return of -1.09%.
| Exhibit 3: Three-Year Absolute Returns of the S&P BSE AllCap Series | |||
| INDEX | INDEX VALUE ON MAY 31, 2014 | INDEX VALUE ON MAY 31, 2017 | 3-YEAR ABSOLUTE RETURN |
| S&P BSE AllCap | 2,964.50 | 4,443.89 | 49.90% |
| S&P BSE LargeCap | 3,169.73 | 4,392.10 | 38.56% |
| S&P BSE MidCap | 9,486.29 | 17,029.70 | 79.52% |
| S&P BSE SmallCap | 10,151.26 | 17,471.09 | 72.11% |
| S&P BSE Consumer Discretionary Goods & Services | 2,221.81 | 4,154.63 | 86.99% |
| S&P BSE Finance | 3,685.57 | 6,208.31 | 68.45% |
| S&P BSE Basic Materials | 2,244.72 | 3,460.52 | 54.16% |
| S&P BSE Fast Moving Consumer Goods | 8,059.50 | 12,402.82 | 53.89% |
| S&P BSE Healthcare | 11,138.54 | 14,868.22 | 33.48% |
| S&P BSE Energy | 3,247.41 | 4,334.31 | 33.47% |
| S&P BSE Industrials | 2,898.42 | 3,854.31 | 32.98% |
| S&P BSE Information Technology | 9,615.65 | 12,340.20 | 28.33% |
| S&P BSE Utilities | 1,971.70 | 2,389.95 | 21.21% |
| S&P BSE Telecom | 1,364.29 | 1,349.36 | -1.09% |
Source: S&P Dow Jones Indices LLC. Data from May 31, 2014, to May 31, 2017. Table is provided for illustrative purposes. Past performance is no guarantee of future results.
The posts on this blog are opinions, not advice. Please read our Disclaimers.