

The mid-cap space has often been described as the “sweet spot” of equity investing—and with good reason. Mid-cap companies tend to offer a balance between the high growth (and high risk) offered by small caps and the stability (but relatively slower growth) of large caps. Additionally, Indian mid-caps have a more diverse sector representation than large caps, which have a relatively higher weight in the BSE sector of finance (32%), while small caps have a relatively lower weight in energy. Over the long term, these unique characteristics have helped India’s mid-cap segment outperform all other size categories on an absolute and risk-adjusted basis (see Exhibits 1, 2, and 3).
Exhibit 1: Index Performance Since Inception
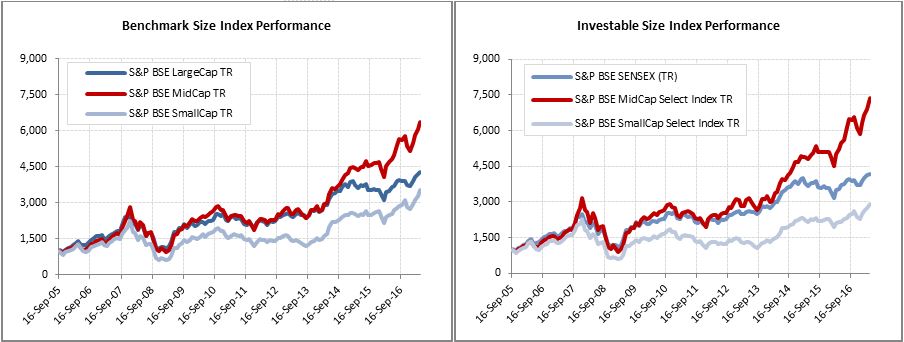
Source: Asia Index Pvt. Ltd. Data from Sept. 16, 2005, to April 28, 2017. Index performance based on total return in INR. Past performance is no guarantee of future results. Charts are provided for illustrative purposes and reflects hypothetical historical performance. The S&P BSE LargeCap, S&P BSE Midcap, and S&P BSE SmallCap were launched on April 15, 2015. The S&P BSE MidCap Select and S&P SmallCap Select were launched on June 15, 2015.
| Exhibit 2: BSE Sector Weights | ||||||
| BSE SECTORS | BENCHMARK SIZE INDICES | INVESTABLE SIZE INDICES | ||||
| S&P BSE LARGECAP | S&P BSE MIDCAP | S&P BSE SMALLCAP | S&P BSE SENSEX | S&P BSE MIDCAP SELECT | S&P BSE SMALLCAP SELECT | |
| Basic Materials (%) | 6.4 | 11.5 | 13.3 | 1.1 | 13.7 | 12.2 |
| Consumer Discretionary (%) | 11.0 | 14.5 | 24.1 | 10.2 | 11.5 | 19.7 |
| Energy (%) | 10.8 | 7.4 | 1.3 | 11.5 | 9.6 | 0.0 |
| Finance (%) | 32.2 | 24.1 | 18.1 | 32.7 | 23.2 | 29.7 |
| FMCG (%) | 10.3 | 8.8 | 5.2 | 11.1 | 6.8 | 0.0 |
| Healthcare (%) | 5.1 | 10.9 | 7.3 | 5.9 | 11.6 | 10.1 |
| Industrials (%) | 8.1 | 13.7 | 22.3 | 9.4 | 16.7 | 17.3 |
| Information Technology (%) | 10.9 | 1.7 | 4.2 | 12.3 | 1.8 | 4.9 |
| Telecom (%) | 2.0 | 1.2 | 0.8 | 1.7 | 0.0 | 0.0 |
| Utilities (%) | 3.2 | 6.3 | 3.4 | 4.1 | 5.3 | 6.0 |
| Total (%) | 100.0 | 100.0 | 100.0 | 100.0 | 100.0 | 100.0 |
Source: Asia Index Pvt. Ltd. Data as of April 28, 2017. Table is provided for illustrative purposes.
As of April 28, 2017, mid-cap stocks comprised 85 companies and approximately INR 18,61,340 crores (USD 11,416 billion) in total market cap, as measured by S&P BSE MidCap, representing nearly 16% of the broad market S&P BSE AllCap.
As of June 15, 2015, Asia Index Pvt. Ltd launched some investable size indices—the S&P BSE MidCap Select and S&P BSE SmallCap Select, which include the top 30 and 60 stocks, respectively, after relatively stringent liquidity filters.
Exhibit 3 demonstrates that for the 10-year period ending April 28, 2017, the S&P BSE MidCap and S&P BSE MidCap Select consistently outperformed their peer size indices. Unsurprisingly, Indian mid-cap companies experienced higher volatility than large-cap companies but lower volatility than small-cap companies. However, market participants were more than compensated for the higher risk, as the S&P BSE MidCap and S&P BSE MidCap Select recorded higher risk-adjusted returns.
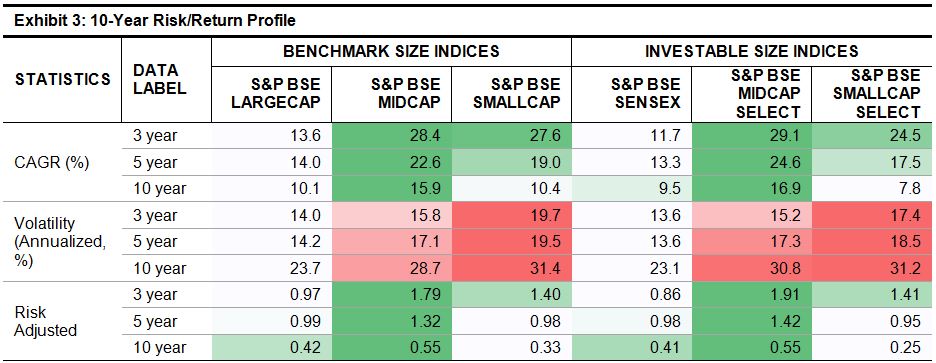
Source: Asia Index Pvt. Ltd. Data from Sept. 16, 2005, to April 28, 2017. Index performance based on total return in INR. Table is provided for illustrative purposes and reflects hypothetical historical performance.
A unique combination of potential for higher growth than large caps and relatively better stability (lower volatility) than small cap, along with diversification across BSE sectors, has led the S&P BSE MidCap and S&P BSE MidCap Select to outperform their large- and small-cap counterparts over the long term.
ICICI Prudential Asset Management Company last year launched an ETF that tracks the S&P BSE MidCap Select.
The posts on this blog are opinions, not advice. Please read our Disclaimers.


