Get Indexology® Blog updates via email.

In This List

Why Companies and Investors Need to Value Water Differently

Next Generation Retirement Investing

If the Performance Doesn’t Get You, the Taxes Might

Will Low-Carbon Trends in the U.S. Continue?

S&P BSE SENSEX Index Series

Why Companies and Investors Need to Value Water Differently

Contributor Image
Libby Bernick

Global Head of Corporate Business

Trucost, part of S&P Dow Jones Indices

March 22, 2017, is World Water Day, the U.N.’s annual bid to raise awareness about the water crisis.  Climate change, pollution, and overconsumption are making fresh water an increasingly scarce resource.  Worldwide, 663 million people currently have no access to clean water.  By 2030, it is predicted that there will be a 40% shortfall in water supplies.[1]

Good quality water is essential to the production of nearly everything, from the food we eat to the clothes we wear.  Trucost research found that in 2016, listed companies reported exposure to water risks totaling almost USD 126 billion, due to higher operating costs associated with declining water quality and water supply disruption.  However, when taking into account the thousands of listed companies that do not disclose on water dependency, the risk could be up to USD 439 billion.

The main problem is the lack of an appropriate market price for water—one that reflects its full economic, social, and environmental value.  In most regions, there is little correlation between the price paid for water and its availability or quality.  In many places, water is cheapest where it is most scarce.  Weak regulation means water basins can be polluted by effluent discharges.

As good quality water gets scarcer, companies become increasingly exposed to water-related risks.  Market participants are also exposed to these risks through equity holdings, corporate loans, and project finance in water-intensive sectors.

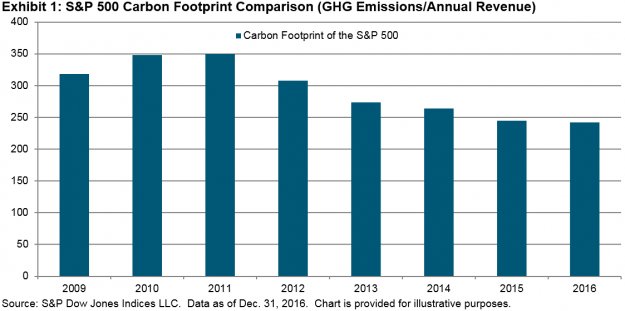
Analysis by Trucost shows that if the full costs of water scarcity and pollution had to be absorbed by companies as a result of reduced water allocations, higher conditioning costs, or tougher effluent discharge requirements, average profits could fall by 18% in the chemical sector, 44% in the utilities sectors, and a massive 116% in the food and beverage sector (see Exhibit 1).

To understand and manage these risks, companies need better data on where water risks are in their global operations.  Analytical tools, such as Aqueduct by the World Resources Institute,[2] provide a way to screen locations where water is scarce.

Ecolab’s Water Risk Monetizer[3]—powered by Trucost and Microsoft—extends the insights from the Aqueduct tool and puts a monetary value on water risks, including scarcity and quality, so that they can be factored alongside operational costs and revenue forecasts.  The Water Risk Monetizer also allows users to calculate asset-level avoided risk and return on investment of water improvement projects, illustrating how businesses should prioritize investments, engage with other water users, and monitor local water conditions.

Market participants can manage risk by encouraging better corporate disclosure of water-related financial risks.  This was recognized in draft recommendations published by the Financial Stability Board’s Task Force on Climate-related Disclosures[4] in December 2016, which said that all organizations, from companies to financial institutions, should disclose information on their governance, strategy, risk management, metrics, and targets for managing climate risks, including water scarcity.  Enhanced disclosure on water will accelerate mainstream green finance as more relevant information reaches the market.

The first step is for companies and market participants to understand the water risk exposure of operations, suppliers, assets, and investments so they can build resilience against increasing water scarcity and pollution impacts, identify opportunities from water stewardship solutions, and engage with stakeholders to drive change through the market.

[1]   http://unesdoc.unesco.org/images/0023/002318/231823E.pdf

[2]   http://www.wri.org/our-work/project/aqueduct

[3]   http://waterriskmonetizer.com/

[4]   https://www.fsb-tcfd.org/publications/recommendations-report/


The posts on this blog are opinions, not advice. Please read our Disclaimers.

Next Generation Retirement Investing

Contributor Image
Massi DeSantis, PhD

Vice President

Dimensional Fund Advisors

For many plan participants, the goal of a retirement account is to provide a steady stream of income that will sustain their standard of living in retirement. Therefore, participants need a framework that aligns the management of their savings with their retirement income goal. This framework has three related components:

  1. Risk management that addresses the risks that are relevant to retirement income.
  2. Asset allocation that balances the tradeoff between asset growth and income risk management.
  3. Meaningful communication that enables participants to monitor performance in income units.

Risk Management
The first consideration regarding risk management is how long you expect participants’ accumulated savings to support their consumption in retirement. In the US, the average life expectancy of a 65-year-old person is 85 years.[1] To account for uncertainty about life expectancy, we can add a five-year buffer to the average retirement horizon, resulting in a 25-year expected withdrawal period.

The next step is to identify the key drivers of income uncertainty over that withdrawal period. Retirement income uncertainty is driven by market risk (uncertainty of future stock and bond returns), interest rate risk, and inflation risk. These risks can be reduced by computing the duration of the retirement income stream and allocating to a portfolio of inflation-protected securities that are duration-matched to the planned retirement horizon. This is the basis of the risk management strategy of Dimensional’s retirement solutions and the S&P Shift to Retirement Income and Decumulation (STRIDE) Index Series. This framework also helps to manage sequencing risk, as the level of retirement income that can be supported by the allocation to risk management assets is not very sensitive to market risk, interest rate risk, or inflation risk.

Asset Allocation
Having identified an appropriate risk management strategy, the asset allocation question then becomes a tradeoff between allocating to growth assets vs. risk management assets. The higher the allocation to risk management assets, the lower the expected volatility of retirement income. In launching the S&P STRIDE Indices, S&P Dow Jones Indices has developed a benchmark for investment solutions that seek to grow the value of participants’ savings while managing retirement income uncertainty. This entails a focus on asset growth early in participants’ lifecycles with a transition to an income-focused strategy over time. As participants transition into retirement, the majority of their assets are invested in inflation-protected government securities matched to their retirement horizon. This liquid investment strategy can be used by participants who desire periodic withdrawals in retirement.

Meaningful Communication
A retirement solution should also allow participants (and their plan sponsors) to monitor progress toward a retirement income goal. This can be achieved through information that translates the purchasing power of participants’ account balances in terms of estimated retirement income. The S&P STRIDE Indices include a monthly cost of retirement income called the Generalized Retirement Income Liability (GRIL)[2] for each retirement cohort, which can be used to translate account balances to estimated retirement income.

If the GRIL goes up (down), generating a given level of income becomes more (less) costly, and the purchasing power of a given level of savings goes down (up). Because of the risk management framework in the S&P STRIDE Indices, uncertainty about participants’ future income is reduced over time so that communication in income units can be more meaningful. We believe the right risk management helps provide clarity about expected retirement outcomes and empowers participants to make better retirement decisions.

[1] Source: Social Security Administration: Calculators – Life Expectancy. The age of 85 is computed by averaging the male life expectancy and the female life expectancy for people turning 65 in 2017.
[2] GRIL is defined as the present value of $1 of annual inflation-adjusted income over 25 years starting at the target date. The interest rates used to discount these future hypothetical cash flows to the present are derived from the current US TIPS curve.

The S&P STRIDE INDEX is a product of S&P Dow Jones Indices LLC or its affiliates (“SPDJI”) and has been licensed for use by Dimensional Fund Advisors LP (“Dimensional”). Standard & Poor’s® and S&P® are registered trademarks of Standard & Poor’s Financial Services LLC (“S&P”); Dow Jones® is a registered trademark of Dow Jones Trademark Holdings LLC (“Dow Jones”); these trademarks have been licensed for use by SPDJI and sublicensed for certain purposes by Dimensional. Dimensional’s Products, as defined by Dimensional from time to time, are not sponsored, endorsed, sold, or promoted by SPDJI, S&P, Dow Jones, or their respective affiliates, and none of such parties make any representation regarding the advisability of investing in such products nor do they have any liability for any errors, omissions, or interruptions of the S&P STRIDE Index.
Dimensional Fund Advisors LP receives compensation from S&P Dow Jones Indices in connection with licensing rights to the S&P STRIDE Indices. It is not possible to invest in an index.

The posts on this blog are opinions, not advice. Please read our Disclaimers.

If the Performance Doesn’t Get You, the Taxes Might

Contributor Image
Michael Mell

Global Head of Custom Indices

S&P Dow Jones Indices

Assets are shifting from active to passive: “investors pulled $23 billion out of actively managed U.S. equity funds, extending the group’s streak of outflows to 33 consecutive months.  During 2016, passive fund strategies in the United States took in a record $504.8 billion.”[1]  In response to this, an elegant point has been made “that the average investment manager does not outpace the market over meaningful time horizons.  However, a fairly simple fact has gotten lost in the debate.  Simply put, not all investment managers are average”[2] and that the way to find these managers is by screening for low-cost active funds and managers who are participating in the funds they run.  Thus an active approach can add value by beating its benchmark when costs are reasonable and the manager’s incentives are aligned with fund those of the fund’s participants.

You Forgot About My Taxes!

Understanding that past performance does not guarantee future results, it is possible that one day active management may prove its value beyond a select population of low-cost and self-invested fund managers.  However, “passive management, as many studies have demonstrated, almost always wins out in the long term—both because it’s inherently more tax effective and because it’s less costly,”[3] and while not every active manager is average and many do offer low cost solutions, the impact of taxes is another factor that must be considered in the analysis. It’s important to note “on an after-tax basis, managers of stock funds for large- and mid-sized companies produced lower returns than their index-style competitors 97% of the time, while managers of small-cap stocks trailed 77% of the time.”[4]  Furthermore, “taxes knocked an average of 0.96 percentage point a year off the returns of about 2,000 actively managed U.S. stock mutual funds over the 15 years ended in September 2014, if they were held in taxable accounts rather than tax-sheltered retirement plans, according to research by Vanguard Group. By contrast, taxes reduced the returns of 130 broad-based U.S. stock index funds by an average of 0.69 percentage point a year over the same period—about one third less.”[5]

You Can’t Keep Going!

Financial advisor Steven Lockshin reviewed S&P DJI’s December 2016  Persistence Scorecard as it pertains to active management and noted that:

  • Relatively few funds can stay at the top. Out of 631 domestic equity funds that were in the top quartile as of September 2014, only 2.85% managed to stay in the top quartile at the end of September 2016.  Furthermore, 2.46% of the large-cap funds, 2.20% of the mid-cap funds, and 3.36% of the small-cap funds remained in the top quartile;
  • The figures are equally unfavorable when viewed over longer-term investment horizons. Over the five-year period, 91.91% of large-cap managers, 87.87% of mid-cap managers, and 97.58% of small-cap managers lagged their respective benchmarks;
  • Similarly, over the 10-year investment horizon, 85.36% of large-cap managers, 91.27% of mid-cap managers, and 90.75% of small-cap managers failed to outperform on a relative basis.[6]

This is important because when one participates in an active mutual fund, the statistical odds of continued outperformance against the benchmark are not high.  When taxes are factored into the analysis, the picture arguably becomes more compelling for the use of passive strategies.

Taxes Are Not Just an Issue for Active Mutual Funds

Beyond the tax issue for active mutual funds, “taxpayers should beware that as IRAs increase in size, so does the potential for taxes on these accounts if they have investments in alternative assets such as hedge funds, private-equity funds, limited partnership, operating businesses and real-estate.”[7]  So if hedge funds or private equity funds seem appealing, just remember their tax costs could be significant, even in an IRA.

The Bottom Line

The bottom line when considering active versus passive investing is if the performance of an active strategy does not get you, the taxes might.

[1]   https://corporate.morningstar.com/US/documents/AssetFlows/AssetFlowsJan2017.pdf

[2]   https://www.americanfunds.com/individual/insights/active-management/adding-our-voice-indexing.html

[3]   Steven Lockshin, http://www.iris.xyz/network/active-investments-lot-hope-dangerous

[4]“             Active vs. Passive Investing: Which Approach Offers Better Returns?” http://executiveeducation.wharton.upenn.edu/thought-leadership/wharton-wealth-management-initiative/wmi-thought-leadership/active-vs-passive-investing-which-approach-offers-better-returns

[5]   Laura Saunders, https://www.wsj.com/articles/how-passive-funds-trim-your-tax-bill-1476968401

[6]   Steven Lockshin, http://www.iris.xyz/network/active-investments-lot-hope-dangerous

[7] Laura Saunders, https://www.wsj.com/articles/are-taxes-lurking-in-your-tax-free-retirement-account-1489141814

The posts on this blog are opinions, not advice. Please read our Disclaimers.

Will Low-Carbon Trends in the U.S. Continue?

Contributor Image
Emily Ulrich

Former Senior Product Manager, ESG Indices

S&P Dow Jones Indices

When people think of a low-carbon economy, the U.S. may not be the first one to come to mind.  In almost all things ESG, Europe is considered the leader.  However, the U.S. market has made some strides in recent years.  The carbon footprint of the S&P 500® has actually been declining since 2011, as illustrated in Exhibit 1.

This is good news for ESG market participants, although this decline has also started to stagnate, signaling that the low-carbon economy in the U.S. is at a critical point, with two possible outcomes.

On one hand, the head of the Environmental Protection Agency (EPA) recently questioned the role of carbon dioxide as a harmful pollutant—portending the potential future policy changes by the EPA.[1]  To put this in to context, back in 2007, the Supreme Court ruled that carbon dioxide was an air pollutant and that under the Clean Air Act, the EPA was all but required to regulate carbon dioxide, unless they were able to provide scientific evidence that greenhouse gases (GHGs) were not harmful.[2]  The recent statement questioning the link between carbon and climate change makes it look like the EPA may be leaning toward the latter part, and therefore attempting to deregulate the carbon economies—a concern for those focused on socially responsible investing.

On the other hand, while the change in EPA policy may be disheartening, it’s clear that the global markets feel differently.  This new stance signals a widely different viewpoint than most other countries around the globe.  In November 2016, delegates from 197 countries met in Marrakesh for COP 22, an annual climate change conference designed to reduce the production of GHGs.  This was a follow up to COP 21 in 2015, where these same countries (including the U.S.) met and signed the Paris Agreement, with the goal of preventing global temperatures from rising more than 2˚C above pre-industrial times.

In addition, market participant interest is increasingly focused on low carbon, particularly as those indices outperform the benchmark.  As illustrated by Exhibit 2, the S&P 500 Carbon Efficient Index and the S&P 500 Carbon Efficient Select Index have continued to outperform the benchmark (ever so slightly).

While public policy may no longer be implementing environmental regulation, market participant interest may be the driving force behind carbon reductions in the U.S.  We can expect that the world will continue to try to offset the damage done by GHGs—regardless of policy in the U.S.—and these efforts are likely to continue to affect financial markets, where interest in ESG investing continues to grow.

[1] http://www.reuters.com/article/us-usa-epa-pruitt-idUSKBN16G1XX

[2] http://www.nytimes.com/2007/04/03/washington/03scotus.html

The posts on this blog are opinions, not advice. Please read our Disclaimers.

S&P BSE SENSEX Index Series

Contributor Image
Mahavir Kaswa

Former Associate Director, Product Management

S&P BSE Indices

The S&P BSE SENSEX is India’s bellwether index and is a globally recognized benchmark.  With the recent launch of the S&P BSE SENSEX 50 and S&P BSE SENSEX Next 50, Asia Index Pvt. Ltd. has expanded its S&P BSE SENSEX Index Series.  The newly launched indices are designed to measure the top 50 companies and the next set of 50 companies after the top 50 in the Indian market, respectively. Like other S&P BSE Indices, both adopt rules-based, transparent, and objective index methodologies.

Constituents are selected from the top 100 companies based on float-adjusted market cap and stringent liquidity filters.  The top 50 companies form the S&P BSE SENSEX 50, while remaining 50 companies from the pool form the S&P BSE SENSEX Next 50.

All three indices are diversified by BSE sectors, which reflect the respective weights of the sectors in the Indian market.  The key differences between these indices are number of companies covered and sector/size coverage. Finance and Information Technology are two largest BSE Sectors in S&P BSE SENSEX and S&P BSE SENSEX 50 indices; however Basic Materials and Finance are the two largest sectors in S&P BSE SENSEX Next 50 index. S&P BSE SESENSEX and S&P BSE SENSEX 50 covers nearly 52% and 65% of free float market capitalization of S&P BSE AllCap index respectively.

All three indices are designed to be investable, and their methodologies require stringent liquidity filters. The indices are weighted by float-adjusted market cap, similar to the methodology used by other index providers globally.  In order to keep index composition current and relevant to the market, the indices undergo rebalancing semiannually, in June and December.

Let’s look at the performance of each of them.

Exhibit 1: Performance of S&P BSE SENSEX Indices

Source: Asia Index Private Limited and S&P Dow Jones Indices LLC.  Data as of March 6, 2017.  Past performance is no guarantee of future results.  Chart is provided for illustrative purposes and reflects hypothetical historical performance.  The S&P BSE SENSEX 50 was launched on Dec. 6, 2016.  The S&P BSE SENSEX Next 50 was launched on Feb. 27, 2017.

Exhibit 2: Risk/Return Characteristics of S&P BSE SENSEX Indices
STATISTICS PERIOD S&P BSE SENSEX S&P BSE SENSEX 50 S&P BSE SENSEX NEXT 50
Absolute Returns YTD 9.2% 9.8% 14.1%
Annualized Returns (CAGR) 1 Year 19.67% 21.68% 37.43%
5 Year 12.81% 13.26% 17.89%
10 Year 10.20% 10.73% 15.50%
Annualized Volatility 1 Year 12.34% 12.38% 16.50%
5 Year 14.89% 14.88% 18.56%
10 Year 23.63% 23.55% 24.07%

Source: Asia Index Private Limited and S&P Dow Jones Indices LLC.  Data as of March 6, 2017.  Past performance is no guarantee of future results.  Table is provided for illustrative purposes and reflects hypothetical historical performance.  The S&P BSE SENSEX 50 was launched on Dec. 6, 2016.  The S&P BSE SENSEX Next 50 was launched on Feb. 27, 2017.

Since nearly 80% of S&P BSE SENSEX 50’s index weight overlaps with constituents of the S&P BSE SENSEX, the risk/return characteristics of the indices are similar.  The S&P BSE SENSEX Next 50 has a unique set of 50 companies, with nearly 55% of the index weight coming from mid-cap stocks, and it has shown consistently higher total returns than the other indices, with marginally higher volatility.

Exhibit 3: Sector and Size Composition
BSE SECTOR S&P BSE SENSEX S&P BSE SENSEX 50 S&P BSE SENSEX NEXT 50
Basic Materials (%) 1.2 2.7 23.8
Consumer Discretionary (%) 10.0 11.9 7.0
Energy (%) 11.3 11.2 7.4
Fast Moving Consumer Goods (%) 10.8 9.9 13.9
Finance (%) 31.4 32.5 19.9
Healthcare (%) 6.6 5.8 9.2
Industrials (%) 8.9 7.5 11.2
Information Technology (%) 13.9 13.4 1.3
Telecom (%) 1.8 1.9 2.8
Utilities (%) 4.1 3.2 3.5
Total (%) 100.0 100.0 100.0
BSE SIZE
LargeCap (%) 100.0 99.2 45.0
MidCap (%) 0.0 0.8 55.0
Total (%) 100.0 100.0 100.0

Source: Asia Index Private Limited.  Total returns and volatility as of March 6, 2017.  Past performance is no guarantee of future results.  Table is provided for illustrative purposes and reflects hypothetical historical performance.  The S&P BSE SENSEX 50 was launched on Dec. 6, 2016.  The S&P BSE SENSEX Next 50 was launched on Feb. 27, 2017.

The posts on this blog are opinions, not advice. Please read our Disclaimers.