Get Indexology® Blog updates via email.

In This List

S&P BSE SENSEX Performance during Budget Sessions over the Past Decade

Longer-Maturity and Lower-Rated Sukuk Continue to Outperform

Approaches to Achieving Low Volatility

Rieger Report: The Uncorrelated

Happy Valentine's Day: Cocoa Hits Lowest Since 2008

S&P BSE SENSEX Performance during Budget Sessions over the Past Decade

Contributor Image
Ved Malla

Associate Director, Client Coverage

S&P Dow Jones Indices

The S&P BSE SENSEX acts as an indicator of the economic growth of the Indian economy.  Any national or international change in economic activity has an impact on the S&P BSE SENSEX.  In India, market participants are interested in knowing how movements in the S&P BSE SENSEX are related to various changes in economic activities.  Every year, the Finance Minister presents the Union Budget, which is perhaps the most important economic activity in India.  “Budget Day” comes with a lot of expectations, and it therefore has a bearing on the capital markets in both the pre- and post-budget sessions.  The days before and after the budget session can also bring volatility in the capital markets.

The S&P BSE SENSEX’s total return increased from 17,190 on Jan. 31, 2007, to 38,926 on Jan. 31, 2017 (see Exhibit 1).  This represents a 10-year CAGR of 8.52% for the period.

Exhibit 1: S&P BSE SENSEX Total Return Index

Source: S&P Dow Jones Indices LLC.  Data from Jan. 31, 2007, to Jan. 31, 2017.  Chart is provided for illustrative purposes.  Past performance is no guarantee of future results.

During the past decade, India has been led by the Indian National Congress and the Bhartiya Janta Party, the two largest national-level political parties in the country.  Mr. P. Chidambaram and Mr. Pranab Mukherjee were the Finance Ministers during the Congress regimes and presented the budgets from 2007 to 2013.  The Bhartiya Janta Party came to power in 2014, and Mr. Arun Jaitley has been the Finance Minister since then.

Exhibit 2 showcases the various budgets, along with which Finance Minister presented the budget and the 30-day pre- and post-budget returns of the S&P BSE SENSEX.

Exhibit 2: 30–day Pre and Post-Budget Day returns of the S&P BSE SENSEX

Source: S&P Dow Jones Indices LLC.  Data from January 2007 to February 2017.  Chart is provided for illustrative purposes.  Past performance is no guarantee of future results.

It can be seen in Exhibit 2 that in most years, the S&P BSE SENSEX witnessed high volatility in the 30-day pre- and post-budget sessions.  The S&P BSE SENSEX saw its lowest return during these sessions in 2008, when the index fell in both (with returns of -6.2% in the pre-budget session and -7.5% in the post-budget session).  The best post-budget performance was in 2016, when the index increased 11.8% in the 30 days following the budget day.  In 2010 and 2011, the pre-budget returns were negative (-7.5% and -6.1%, respectively), but the post-budget returns were positive (8.6% and 11.3%, respectively).  The S&P BSE SENSEX has had positive performance this year, with a return of 5.1% in the 30-day pre-budget session.

To conclude, we can say that the budget sessions are usually volatile for capital markets in India.  The pre-budget movement is caused by market participant expectations for the budget, while the post-budget movement is based on the actual budget presented by the Finance Minister.  The budget may be the most important economic activity affecting capital markets in India, and its relevance is captured in the movement of S&P BSE SENSEX.

The posts on this blog are opinions, not advice. Please read our Disclaimers.

Longer-Maturity and Lower-Rated Sukuk Continue to Outperform

Contributor Image
Michele Leung

Former Director, Fixed Income Indices

S&P Dow Jones Indices

The Dow Jones Sukuk Total Return Index (ex-Reinvestment), which seeks to track USD-denominated, investment-grade sukuk, had a great start in 2017 and rose 1.24% year-to-date (YTD) as of Feb. 10, 2017. A total of 19 sukuk with total outstanding par of USD 15.75 billion were added into the index last year; however, no new sukuk issuances are eligible for inclusion so far this year.

Longer-maturity sukuk continued to outperform among the maturities-based subindices YTD. The Dow Jones Sukuk 7-10 Year Total Return Index rose 2.16% YTD and 6.52% over the one-year period. Similarly, the Dow Jones Sukuk 5-7 Year Total Return Index gained 0.90% YTD and 5.70% over the one-year period. Looking into the historical total return performance, this trend has been consistent in the one-, three-, and five-year timeframes.

Among the ratings-based subindices, the bucket rated ‘BBB’ gained 1.62% YTD, followed by the ‘A’ category, which was up by 1.38% YTD. The biggest exposure in the Dow Jones Sukuk BBB Rated Total Return Index was Indonesia sovereign sukuk, which represents over 40% of the index. The Dow Jones Sukuk AAA Rated Total Return Index was the underperformer in the five-year period.

These performance trends coincided with the sukuk issuance in 2016. According to the Dow Jones Sukuk Total Return Index (ex-Reinvestment), all 19 sukuk added into the index with a tenor of at least five years, six have maturities of 10 years or longer.  In addition, 11 out of 19 are ‘BBB’-rated sukuk, while six have a rating of ‘A’ and only two have a rating of ‘AAA’.

Exhibit 1: Total Return Performance of the Dow Jones Sukuk Maturities-Based Subindices

Exhibit 2: Total Return Performance of the Dow Jones Sukuk Ratings-Based Subindices

The posts on this blog are opinions, not advice. Please read our Disclaimers.

Approaches to Achieving Low Volatility

Contributor Image
Phillip Brzenk

Managing Director, Global Head of Multi-Asset Indices

S&P Dow Jones Indices

Low volatility has been one of the most in vogue strategies during the past decade, with market participants still cognizant of the drawdowns that occurred during the financial crisis.  At S&P DJI, two of the most common strategies are applied to the S&P 500® universe to capture the low volatility anomaly—which is the observation that over the long term, less-volatile stocks have outperformed more-volatile stocks on a risk-adjusted basis.  Both the S&P 500 Low Volatility Index and the S&P 500 Minimum Volatility Index have historically taken advantage of this anomaly, but the portfolio construction approaches for these indices are quite different.  Exhibit 1 gives an overview of the methodology differences:

The S&P 500 Low Volatility Index employs a rankings-based approach, where stocks in the S&P 500 are sorted by the past one-year volatility of returns, and the 100 stocks with the lowest volatility are selected for index inclusion.  The index does not consider other constraints in portfolio construction (e.g., sector concentration or turnover) and instead simply selects the least volatile stocks.  The S&P 500 Minimum Volatility Index employs what could be considered a more sophisticated approach, using an optimizer and risk model to gain exposure to the price volatility factor, while also controlling for things such as unintended exposure to other factors, active sector weights versus the benchmark, and rebalance turnover.

A simple way to see that the two methodologies can lead to meaningfully different portfolios is to look at the constituent overlap, or how many stocks are constituents of both indices.  At year-end 2016, the S&P 500 Minimum Volatility Index had 96 constituents; just 44 of those were also constituents of the S&P 500 Low Volatility Index—less than a 50% overlap.  The differences in portfolio composition lead to deviations in sector composition, return attribution, and factor exposures, all of which are discussed in our recently released paper, Inside Low Volatility Indices.

The posts on this blog are opinions, not advice. Please read our Disclaimers.

Rieger Report: The Uncorrelated

Contributor Image
J.R. Rieger

Former Head of Fixed Income Indices

S&P Dow Jones Indices

Why worry?  New highs for the U.S. stock market indices will keep coming, right?  Just in case, this might be a good time to examine asset classes that are not correlated to the equity market or the “uncorrelated”.

Corporate bonds of the issuers in the S&P 500 are tracked in the S&P 500 Bond Index.  As a group they have seen a negative correlation to the equities market.  Heavily composed of investment grade bonds the index has recorded a positive return of 0.65% year-to-date and a weighted average yield of 3.3%

Investment grade municipal bonds also historically have had negative correlations to the equities markets.  The S&P National AMT-Free Municipal Bond Index has recorded a 0.72% total return year-to-date.  These tax-exempt bonds have a weighted average yield of 2.31%.

Senior loans are higher in the capital market structure than unsecured high yield bonds and are also floating rate instruments.  These characteristics help make them less correlated with the equities market as well as the fixed rate bond markets.  The S&P/LSTA U.S. Leverage Loan 100 Index has recorded a positive return of 0.30% year-to-date.  The floating rate senior loans tracked in this index have a weighted average yield to maturity of 4.76%.

High yield or “junk” bonds tend to be more highly correlated to equities due the their position in the capital market structure.  As a result, junk bond and stock prices can at times move in the same direction based on the market’s perception of the companies strength or weakness.  With a weighted average yield of 5.85% the S&P U.S. High Yield Corporate Bond Index the index is up 1.57% compared to the S&P 500 Index which is up 3.66% (total return).

Table 1:  Select asset classes and their correlations to the S&P 500 Index:

Source: S&P Dow Jones Indices, LLC. Data as of February 10, 2017. Table is provided for illustrative purposes. It is not possible to invest directly in an index. Past performance is no guarantee of future results.


The posts on this blog are opinions, not advice. Please read our Disclaimers.

Happy Valentine's Day: Cocoa Hits Lowest Since 2008

Contributor Image
Jodie Gunzberg

Former Managing Director, Head of U.S. Equities

S&P Dow Jones Indices

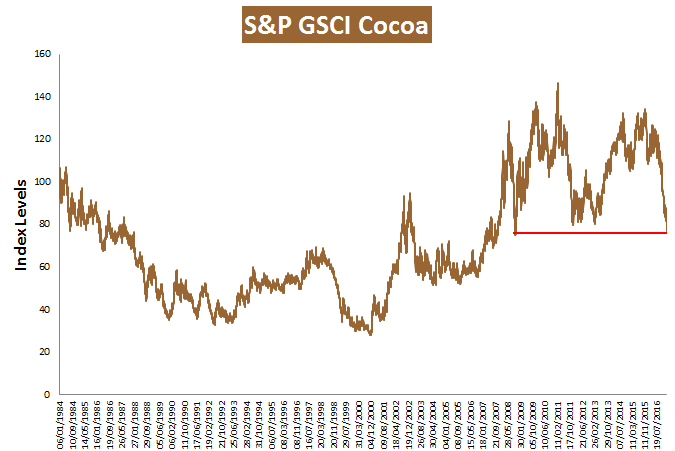
If you buy a little extra chocolate this year for your Valentine, your wallet will be as happy as your sweetheart.  The S&P GSCI Cocoa is at its lowest level (closing Feb. 10, 2017) since Nov. 13, 2008.  It is down 31.3% since last year and is the single commodity with the biggest loss in the past 12 months.  

Source: S&P Dow Jones Indices

According to the International Cocoa Organization (ICCO), the cocoa prices decline was initiated from market expectations of a production surplus for the ongoing 2016/2017 cocoa season; mainly resulting from the prospects of a strong recovery in West African and Latin American production. Also, light rains mixed with hot weather and mild Harmattan winds in most of Ivory Coast’s main cocoa growing regions may boost next year’s crop according to farmers.

One thing to love about cocoa besides the fact that it is relatively cheap now, is that it is the commodity with the most favorable dollar movement ratio of commodities that lose from a rising dollar.  It has very little sensitivity to a rising dollar, losing on average just 6 basis points for every 1% rise in the dollar, yet it gains nearly 3.5% for every 1% the dollar falls.

Source: S&P Dow Jones Indices.


The posts on this blog are opinions, not advice. Please read our Disclaimers.