Get Indexology® Blog updates via email.

In This List

The Dow Quickly Takes a Long Time to Hit 20,000

The New Generation of Green Investors

When Quant and Qual Become One

Inflation

Asian Fixed Income: 2016 Pan Asia Report Card

The Dow Quickly Takes a Long Time to Hit 20,000

Contributor Image
Jamie Farmer

Former Chief Commercial Officer

S&P Dow Jones Indices

Walt Whitman said in Song of MyselfDo I contradict myself? Very well, then I contradict myself, I am large, I contain multitudes.”  Well, as does The Dow Jones Industrial Average – so I’ll present two contradictory data points from today’s record close.

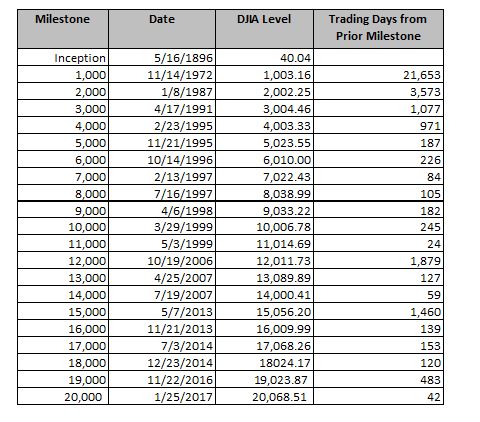
First, the move from 19,000 to 20,000 was quick, happening in just 42 trading days (not calendar days, mind you).  This was the second fastest such move since the DJIA first climbed from 10,000 to 11,000 over 24 days in the spring of 1999.  The longest was from the DJIA’s May 1896 inception to the first 1,000 point level; that run took over 76 years.

Capture

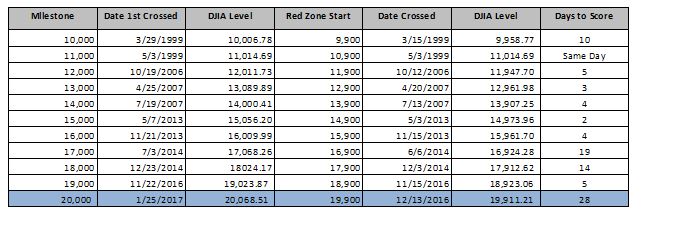
On the other hand, the DJIA took its sweet time meandering through those last 100 points.  As I wrote recently in The Red Zone, the march from 19,900 to 20,000 had already taken more trading sessions than the 10 prior milestones.  In the end, it took 28 trading days to cover that ground.

Capture

Much will be written this week about this first ever close above 20,000.  One of the more common debates is the tug of war between the “psychologically important achievement” and “arbitrary milestone” camps.  I’ll leave the smart people on both sides of the divide to continue to wage that battle.  What I will assert, though, is that no other measure provides us with so much history on which to conduct that battle.  With 120+ years of performance – through expansion, recession, depression, peace-time and war – the DJIA remains an ever-reliable indicator of investor sentiment.

Finally, in transparency the Whitman quote wasn’t the first “contradictory” reference that occurred to me.  Instead, it was this rather less literate doctor’s office scene from Fletch (1985), which I’ll submit here simply because I doubt I’ll ever have any other reason to use it…

Dr. Joseph Dolan: You know, it’s a shame about Ed.
Fletch: Oh, it was. Yeah, it was really a shame. To go so suddenly like that.
Dr. Joseph Dolan: He was dying for years.
Fletch: Sure, but… the end was very… very sudden.
Dr. Joseph Dolan: He was in intensive care for eight weeks.
Fletch: Yeah, but I mean the very end, when he actually died. That was extremely sudden.

The posts on this blog are opinions, not advice. Please read our Disclaimers.

The New Generation of Green Investors

Contributor Image
Ved Malla

Associate Director, Client Coverage

S&P Dow Jones Indices

In recent years, socially responsible investing has gained importance among market participants worldwide.  There has been an increase in the number of those who have become socially conscious and want their investments to go to businesses that acknowledge the relevance of environmental, social, and governance factors to doing business.  Green investment is considered a subset of socially responsible investment that focuses on the environmental aspects of businesses.

Green investors analyze companies based on their policies pertaining to green technologies, climate change, greenhouse gas emissions, renewable energy sources, waste management, pollution control, water management, natural resource conservation, deforestation, etc.  Risks associated with these environmental aspects are looked into, and the company’s management of these risks is assessed. Green investors believe that it is important for companies to manage these risks to remain relevant in the long run.

India has aligned itself with this global trend and has become more sensitive toward the environmental aspects of doing business.  India’s decision to ratify the Paris Climate Change Agreement at the United Nations is proof that the country has become sensitized to environmental issues.  The Indian government has mandated that all companies must spend 2% of their annual net profit on corporate social responsibility activities every year.  This is a major step to promote corporate participation in social causes.  The government of India has also set an ambitious target of building 175 gigawatts of renewable energy capacity by 2022, which will require intensive fundraising.  The government alone cannot finance the green infrastructure initiatives; corporations will also have to participate and support the government on this front.  Many financial institutions and banks have already issued green bonds in India, which have been accepted well by green investors.  The Securities Exchange Board of India is also looking to come up with regulations to promote the issuance and listing of these green bonds. Government initiatives like these could help in the growth and popularity of green investments in India.

The “Green Investor Brigade” is also looking for green investment avenues in capital markets. Equity investment can have an active approach, in which the fund managers actively select companies that they consider to have relatively better green standards.  Another way is to adopt the passive route, in which investments can be made in ETFs or structured products that replicate or are linked to indices. These indices are constructed with a focus on green objectives.  Investing in index-linked products seems to be preferred globally, as leading index providers like S&P Dow Jones Indices have a scientific and rule-based methodology for selecting stocks to create these indices.  Further, passively managed products are cost effective, as they have a low asset-management fee.

The posts on this blog are opinions, not advice. Please read our Disclaimers.

When Quant and Qual Become One

Contributor Image
Emily Ulrich

Former Senior Product Manager, ESG Indices

S&P Dow Jones Indices

I’ve previously written about the convergence of typical “strategy” or “factor” indices with sustainable indices.  In 2016, we saw this rise as a trending topic in the market and we expect the interest to increase in 2017.  This multifaceted approach has been well illustrated in many aspects of our offerings, but I wanted to focus on the S&P Global 1200 Climate Change Low Volatility High Dividend Index this week.

This index series exemplifies this combination approach well, as it incorporates popular strategy methods and sustainable practices through filtering out companies with relatively higher carbon footprints, lower dividend yields, and higher volatility.

One unique aspect of this index is that it utilizes a “carbon normalized score,” which is a product of the carbon footprint (the company’s annual greenhouse gas emissions as carbon dioxide equivalent/annual revenues).

To compare this approach to another standard index, the S&P Global 1200 Carbon Efficient Select Index simply excludes the 20% of companies with the highest carbon footprint per each GICS sector.  This key methodological difference stems from the usage of absolute numbers (instead of percentages) to exclude companies with relatively high carbon intensity.  In order to capture that relativity, and to prevent the index from fully divesting from a sector (energy, I’m looking at you), it employs this “carbon normalized” process.

Exhibit 1 shows the full three-step filtering outline.

Exhibit 1: Three-Step Methodology Process

Following the low carbon selection, a high dividend overlay is applied.  This is secondary so that the final volatility screen can weed out any “value traps,” e.g., stocks that have resulted in high yields but have also experienced high amounts of volatility.

The combination of these three strategies has resulted in an index with a promising history.  As illustrated in Exhibit 2, the S&P Global 1200 Climate Change Low Volatility High Dividend Index has historically outperformed its benchmark.

Exhibit 2: Performance Chart

Looking toward the year ahead, we can expect to see factor-based investing and sustainability continue to grow as popular passive investment strategies.

The posts on this blog are opinions, not advice. Please read our Disclaimers.

Inflation

Contributor Image
David Blitzer

Former Managing Director and Chairman of the Index Committee

S&P Dow Jones Indices

Supported by a stronger economy and higher oil prices, recent readings of inflation are rising. The Fed’s principal gauge, the personal consumption expenditures deflator excluding food and energy (Core PCE) is approaching but still below its 2% target. The more widely recognized CPI and CPI excluding food and energy are both rising and a bit over 2%. (See chart).

While nothing on the horizon suggests a sudden surge in prices, the forces affecting inflation point to a risk that inflation moves higher over the next couple of years. The unemployment rate is under 5% and trending downward and wages are (finally) showing some sign of advancing.  Falling unemployment means that the economy is growing more than fast enough to absorb new entrants to the labor force.  If this continues and unless labor force participation climbs, the unemployment rate will continue dropping and wages are likely to see more gains.   Low and falling unemployment is not the only economic factor behind inflation.

With a growing economy aggregate supply must expand in tandem with aggregate demand if price pressures are to be avoided.  The initial impact of the stimulus packages being discussed by the President and Congress will be on demand.  Lower taxes mean more spending by consumers and business. Government or private sector spending on infrastructure will add to demand now and to effective supply later.  The impact of any stimulus program on inflation or growth depends on how the economy condition at the start of the program. Since the economy is in reasonable shape now, some of that impact will be felt as inflation rather than real GDP growth.

Expectations of future inflation are an important determinant of inflation.  Were business to anticipate rising inflation it would be a reason to raise prices. Expectations depend on recent experience of inflation. Since the last time the core CPI inflation rate was over 2.5% was in 2007, inflation expectations are fairly neutral now. The risk is that a gradual increase from the Fed’s 2% target towards 2.5% or 3% will cause people to re-evaluate their expectations of future inflation.

The prospects for inflation also depend on numerous wild cards. If oil prices spike, or collapse, inflation will do the same. If the economy slips into recession, we will return to worrying about deflation; if GDP growth surges inflation will advance.  But none of these is predictable.

The posts on this blog are opinions, not advice. Please read our Disclaimers.

Asian Fixed Income: 2016 Pan Asia Report Card

Contributor Image
Michele Leung

Former Director, Fixed Income Indices

S&P Dow Jones Indices

The S&P Pan Asia Bond Index, which seeks to track local currency bonds in 10 countries and is calculated in USD, continued to be weighed down by the weakness of local currencies in 2016, dropping 1.86% for the year.  Meanwhile, its yield-to-maturity widened 38 bps to 3.75% YTD.  Reversing the trend seen in 2015, the S&P Pan Asia Government Bond Index was down by 1.33% in 2016, still outperforming the S&P Pan Asia Corporate Bond Index, which fell 3.11% over the same period.  The size of Asia’s local currency bond markets, as measured by the S&P Pan Asia Bond Index, gained 20% to reach USD 10.3 trillion in 2016, reflecting steady market expansion.

The 10 country-level bond indices calculated in local currencies all ended the year with positive total returns.  The three outperforming countries within the S&P Pan Asia Bond Index were Indonesia, India, and the Philippines.  The S&P Indonesia Bond Index increased 13.71% in 2016, while its yield-to-maturity tightened 16 bps to 7.87%, making Indonesia the best-performing country in Pan Asia for the year.  The S&P BSE India Bond Index gained 13.22% YTD, and its yield-to-maturity widened 38 bps to 6.94%.  The S&P Philippines Bond Index added 3.82% YTD, while its yield-to-maturity tightened 7 bps to 4.28%—a strong rally that flipped this market from among the three worst-performing countries in 2015 to one of the three top performers in 2016.

The S&P China Bond Index was up 2.06% in 2016, lagging other countries and its own 2015 return of 8.05%.  Nevertheless, China’s bond market showed sustained growth.  The market value, as tracked by the S&P China Bond Index, increased 38% to RMB 49 trillion in 2016.  Among the sector-level subindices, the S&P China Provincial Bond Index almost tripled its size to RMB 9.5 trillion, while the S&P China Financials Bond Index expanded by 80% in 2016.

20170118a

20170118b

The posts on this blog are opinions, not advice. Please read our Disclaimers.