Get Indexology® Blog updates via email.

In This List

The Little Engine That Could

Sukuk Market in 2016: Year in Review

ESG Investment – A Strategy for Long-Term Value Creation

SRI Community Stands Together

Plus ça change, plus c'est la même chose

The Little Engine That Could

Contributor Image
Philip Murphy

Former Managing Director, Global Head of Index Governance

S&P Dow Jones Indices

Since the U.S. presidential election, headlines touting small-cap performance have almost invariably cited the Russell 2000.  As impressive as that index’s return has been, S&P DJI has a little engine that persistently wins the small-cap race—the S&P SmallCap 600®.  Outperformance of the S&P SmallCap 600 versus the Russell 2000 primarily has to do with two factors: 1) the negative Russell reconstitution effect and 2) our little engine does not try pulling too many low-quality stocks up the hill.  It focuses on a manageable trainload of liquid, higher-quality names, staying clear of micro-caps that trade by appointment and other low-quality stocks.  In a future post, my colleague Aye Soe will discuss the quality effect in greater detail.

Like the S&P MidCap 400®, the S&P SmallCap 600 is governed by the same methodology as the S&P 500®.  Liquidity, free float, and financial viability criteria are identical for all three.  The only difference between their respective rules are the market cap guidelines for new entrants.  Currently, candidates for entry into the S&P SmallCap 600 must have a market cap between USD 400 million and USD 1.8 billion.  The Russell 2000 is not nearly as selective, relying on a mechanical market cap ranking to determine index constituency and extending far into micro-cap territory.

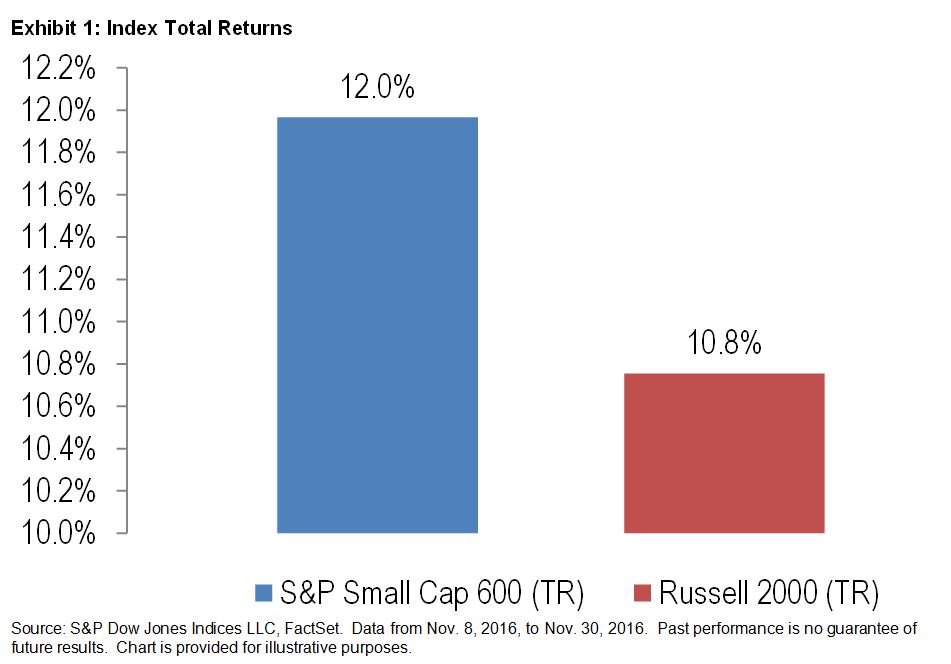
The structural differences between the S&P SmallCap 600 and Russell 2000 have resulted in favorable relative performance for the S&P SmallCap 600.  For example, if we look at the returns of the 16 trading days from election day (Nov. 8, 2016) through Nov. 30, 2016, the S&P SmallCap 600 finished ahead of the Russell 2000 by 1.2% (see Exhibit 1).

capture

Of course, 16 days is an insufficient period from which to draw any conclusions.  Still, in the long run, the S&P SmallCap 600 has historically outshined the Russell 2000—as well as most active small-cap managers (see Exhibit 2).

Exhibit 2: Annualized 10-Year Total Returns of Active Small-Cap Blend Mutual Fund Share Classes and Small-Cap Benchmarks

capture

The implications for small-cap market participants are straightforward.  First, indexing small-cap equities works very effectively.  Market participants, advisors, and fiduciaries may want to consider active fees in light of the historical evidence in favor of indexing.  The notion that it only works in more efficient market segments like large caps is a myth.  Second, the index one selects for access to certain investment spaces or for benchmarking active managers important matters (a lot).  Selecting the Russell 2000 historically resulted in: 1) less return per unit of risk than could have been achieved with the S&P SmallCap 600, or 2) a lower hurdle for expensive active managers to gain outsized fees—more often than not for underperformance.  In short, it is advisable to remember the Little Engine That Could when implementing small-cap exposure.

The posts on this blog are opinions, not advice. Please read our Disclaimers.

Sukuk Market in 2016: Year in Review

Contributor Image
Michele Leung

Former Director, Fixed Income Indices

S&P Dow Jones Indices

Global currency sukuk continued to expand in 2016. Increasing issuances were observed in U.S. dollar, Indonesian rupiah, and Pakistani rupee sukuk, though there were decreases in Malaysian ringgit and Bangladesh taka sukuk compared with last year.[1] The U.S. dollar and Malaysian ringgit sukuk continued to dominate the sukuk market.

The Dow Jones Sukuk Index, which seeks to track U.S. dollar-denominated, investment-grade sukuk, added 17 new sukuk with a total par amount of USD 13.5 billion into the index.  Sovereign sukuk continued to dominate the issuance, including USD 2.5 billion from Indonesia, USD 1.5 billion from Malaysia, USD 1 billion from Turkey, and USD 500 million from Oman.  The biggest corporate sukuk issuances were USD 1.5 billion from IDB Trust, USD 1.2 billion from DP World, and USD 1 billion from Emirates Islamic Bank.  Among all the new issuances, 33% was from the United Arab Emirates.

Looking at the overall country issuance in the Dow Jones Sukuk Index in Exhibit 1, Gulf Cooperation Countries (GCC) remained the largest contributor, at 57%.  For the non-GCC countries, the three biggest are Indonesia, at 15%, Malaysia, at 13%, and Turkey, at 10%.

Exhibit 1: Countries of Risk of the Dow Jones Sukuk Index

 20161209a

In terms of total return performance, the Dow Jones Sukuk Index rose 4.00% YTD as of Nov. 30, 2016 (see Exhibit 2).  The Dow Jones Sukuk Higher Quality Investment Grade Select Total Return Index, which seeks to track sukuk from specified countries of risk, gained 3.54% for the period.  The S&P MENA Sukuk Index, which is designed to measure sukuk issued in the Middle East and African market, advanced 3.97% in the same period.

Among the ratings-based subindices, the sukuk rated ‘BBB’ outperformed and rose 4.84% YTD, while the sukuk rated ‘AA’ also went up 4.43% in the same timeframe.  The longer-maturity indices performed better than the shorter-maturity ones, reversing the trend in 2015.  As of Nov.30, 2016, the Dow Jones Sukuk 5-7 Year Total Return Index and the Dow Jones Sukuk 7-10 Year Total Return Index gained 6.22% and 5.71% YTD, respectively.

Exhibit 2: Total Return Performance of the Dow Jones Sukuk Index Series

20161209b

[1] Source: Thomson Reuters Eikon. Data as of Nov 8, 2016.

The posts on this blog are opinions, not advice. Please read our Disclaimers.

ESG Investment – A Strategy for Long-Term Value Creation

Contributor Image
Ved Malla

Associate Director, Client Coverage

S&P Dow Jones Indices

In the past few years, there has been a paradigm shift in the investment strategy adopted by market participants, wherein they are shifting from a strategy of short-term gain to one of long-term value creation.  Traditionally, market participants have considered publically available records like balance sheets, income statements, and annual reports to analyze the long-term value proposition of companies.  However, they have started to give importance to environmental, social, and governance (ESG) aspects when assessing companies’ long-term strategy for wealth creation.  Globally, ESG factors are considered a mainstream investment strategy.  Market participants now believe that the long-term financial sustainability and value creation of a company are dependent on how a company manages its ESG aspects in the long run.

Let us now discuss the components of ESG individually.

  • Environmental criteria analyze companies based on their policy on green technologies, climate change, greenhouse gas emissions, renewable or alternate energy sources, waste management, pollution control, water management, natural resource conservation, deforestation, Risks associated with these environmental aspects are looked into, and the company’s management of these risks is assessed.
  • Social criteria look at company policies regarding social factors like consumer protection, human rights, working conditions, health and safety measures, employee relations and diversity, etc. The nature of the business is also considered, as many market participants avoid businesses involved in alcohol, tobacco products, gambling, pornography, military, weapons, fossil fuels, and other industries they may not consider socially acceptable.
  • Governance criteria look at transparency in accounting methods, board independence, bribery, corruption, political party donations, executive compensation, disclosures under various regulations, rights of minority shareholders, etc.

ESG investments have matured globally, and many fund managers are tracking various ESG indices like the S&P 500® ESG Index, S&P Global 1200 ESG Index, etc.  Passive fund managers use ETFs or structured products that track an ESG index.  On the other hand, active fund managers depend on ESG scores to make active investment bets.  S&P Dow Jones Indices has partnered with RobecoSAM, a global specialist in sustainability investing, to provide ESG scores.

ESG investing in India is a new concept.  Some banks have issued green bonds that have been well received by market participants.  In the equity space, S&P BSE Indices has two indices in the sustainable investment space—the S&P BSE CARBONEX and S&P BSE GREENEX.  Traditionally, Indian companies have poor ESG disclosures compared with their global peers.  In recent years, some global market participants have pulled their investment from Indian companies because they did not comply with the international ESG standard benchmark.  However, this is undergoing a change, and both corporates and market participants have started to accept the importance of ESG factors in doing business.

ESG investing in India is expected to evolve and align itself with global market trends.  This shift is expected to gain momentum in the next few years in India, and more market participants will likely integrate ESG aspects into mainstream investment decisions, with the ultimate goal of long-term value creation.

The posts on this blog are opinions, not advice. Please read our Disclaimers.

SRI Community Stands Together

Contributor Image
Kelly Tang

Former Director

Global Research & Design

The SRI (Sustainable, Responsible, Impact Investing) conference took place recently in Denver, and it is a three-day conference that brings together asset owners, asset managers, and other investment professionals in the ESG, shareowner advocacy, and impact investing space. The conference is in its 27th year, and given that the conference took place in mid-November—right after the U.S. election results—a great deal of discussion centered on what will become of U.S. climate change policy under a Trump presidency.

The greatest concern was targeted on what the new administration will do in regard to the U.S. climate pledge made by the Obama administration at the COP 21 Paris agreement in December 2015 (see Exhibit 1). During his campaign, President-elect Trump had labeled climate change to be a hoax and vowed to undo the Paris agreement and back out of the USD 100 billion global climate fund to help poorer nations with climate change transition. However, in recent, post-election interviews, he has conceded that there is some connection between human activity and climate change and pledged to have an open mind toward the Paris agreement.

capture

Should the Trump administration ultimately decide to withdraw from the Paris agreement, there are a few different avenues to do so, and they can be pursued simultaneously. While the president cannot unilaterally cancel the Paris deal, he could begin the lengthy process of officially withdrawing the U.S. from the agreement, which is officially already in effect. The lengthiest option is the official withdrawal, which mandates that a country must wait three years to pull out, and once it makes that decision, it must wait another year to actually do so.

Option two would be to withdraw from the parent agreement, called the United Nations Framework Convention on Climate Change (UNFCCC), which has been in effect for 22 years. That agreement allows countries to withdraw with one year’s notice, automatically withdrawing them from any deals that are a subset of the UNFCCC, including the Paris accord. Option three would be easier and faster, but it would require the issuance of an executive order requesting the U.S. Senate to ratify the deal, which it is unlikely to do so.

Given that the new president-elect is moderating his viewpoints from some of the more controversial and polemic comments made during the campaign, what the new administration’s energy policy will shape up to be is a guessing game. For me, the lasting and most salient takeaway from the SRI conference was that the SRI community and its participants represent a formidable proponent who will continue to take action on climate change regardless of government administrations and differing policies. Some of the large asset managers have already joined the 360+ signatories of a new letter at lowcarbonusa.org calling on Trump for continued participation in the Paris agreement. In my next post, I will discuss how the SRI community has mobilized and become a powerful force to reckon with.

The posts on this blog are opinions, not advice. Please read our Disclaimers.

Plus ça change, plus c'est la même chose

Contributor Image
Fei Mei Chan

Former Director, Core Product Management

S&P Dow Jones Indices

This coming Sunday, December 4, 2016, a constitutional referendum will take place and the citizens of Italy will decide on a proposal by Prime Minister Matteo Renzi that, if passed, would mean major changes to Italy’s legislative system. The Prime Minister has stated his intent to resign if the “No” camp triumphs. The political stakes were nicely outlined in an article that appeared in today’s Wall Street Journal. On the same day, Austria will also be electing a new president. That it’s a presidential election rerun is only one indication of the political polarity there as well.

Political turmoil has been common in 2016 and we’ve seen how it has played out in market dynamics when the Brexit referendum and the U.S. presidential election took place. More elections are coming for countries in the Eurozone following those in Austria and Italy, notably the French presidential election. We often look at dispersion to understand better the dynamics of market volatility. The graph below charts the ratio of dispersion at the country level versus dispersion at the sector level for the S&P Eurozone BMI.

More often than not, country dispersion has been lower than sector dispersion, i.e., what you do matters more than where you are…and that continues to be the case for companies in the S&P Eurozone BMI. Despite all the heightened geopolitical drama in the Eurozone it has not translated to heightened risk levels in equity markets. This is corroborated by the muted volatility as indicated by the Euro STOXX 50® Volatility index. It seems the market, at least, doesn’t anticipate traumatic results.

plus-ca-change-plus-cest-la-meme-chose

plus-ca-change-plus-cest-la-meme-chose2

The posts on this blog are opinions, not advice. Please read our Disclaimers.