Get Indexology® Blog updates via email.

In This List

Sukuk Market in 2016: Year in Review

ESG Investment – A Strategy for Long-Term Value Creation

SRI Community Stands Together

Plus ça change, plus c'est la même chose

Base Metals Beat Precious Metals By Most In 26 Years

Sukuk Market in 2016: Year in Review

Contributor Image
Michele Leung

Former Director, Fixed Income Indices

S&P Dow Jones Indices

Global currency sukuk continued to expand in 2016. Increasing issuances were observed in U.S. dollar, Indonesian rupiah, and Pakistani rupee sukuk, though there were decreases in Malaysian ringgit and Bangladesh taka sukuk compared with last year.[1] The U.S. dollar and Malaysian ringgit sukuk continued to dominate the sukuk market.

The Dow Jones Sukuk Index, which seeks to track U.S. dollar-denominated, investment-grade sukuk, added 17 new sukuk with a total par amount of USD 13.5 billion into the index.  Sovereign sukuk continued to dominate the issuance, including USD 2.5 billion from Indonesia, USD 1.5 billion from Malaysia, USD 1 billion from Turkey, and USD 500 million from Oman.  The biggest corporate sukuk issuances were USD 1.5 billion from IDB Trust, USD 1.2 billion from DP World, and USD 1 billion from Emirates Islamic Bank.  Among all the new issuances, 33% was from the United Arab Emirates.

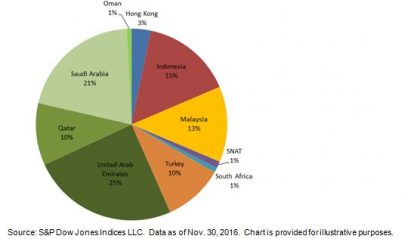
Looking at the overall country issuance in the Dow Jones Sukuk Index in Exhibit 1, Gulf Cooperation Countries (GCC) remained the largest contributor, at 57%.  For the non-GCC countries, the three biggest are Indonesia, at 15%, Malaysia, at 13%, and Turkey, at 10%.

Exhibit 1: Countries of Risk of the Dow Jones Sukuk Index

 20161209a

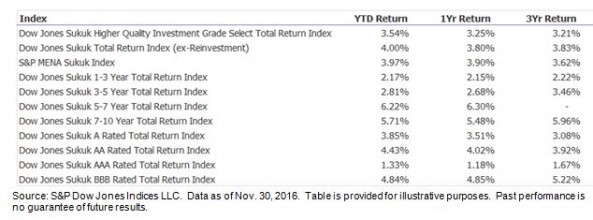
In terms of total return performance, the Dow Jones Sukuk Index rose 4.00% YTD as of Nov. 30, 2016 (see Exhibit 2).  The Dow Jones Sukuk Higher Quality Investment Grade Select Total Return Index, which seeks to track sukuk from specified countries of risk, gained 3.54% for the period.  The S&P MENA Sukuk Index, which is designed to measure sukuk issued in the Middle East and African market, advanced 3.97% in the same period.

Among the ratings-based subindices, the sukuk rated ‘BBB’ outperformed and rose 4.84% YTD, while the sukuk rated ‘AA’ also went up 4.43% in the same timeframe.  The longer-maturity indices performed better than the shorter-maturity ones, reversing the trend in 2015.  As of Nov.30, 2016, the Dow Jones Sukuk 5-7 Year Total Return Index and the Dow Jones Sukuk 7-10 Year Total Return Index gained 6.22% and 5.71% YTD, respectively.

Exhibit 2: Total Return Performance of the Dow Jones Sukuk Index Series

20161209b

[1] Source: Thomson Reuters Eikon. Data as of Nov 8, 2016.

The posts on this blog are opinions, not advice. Please read our Disclaimers.

ESG Investment – A Strategy for Long-Term Value Creation

Contributor Image
Ved Malla

Associate Director, Client Coverage

S&P Dow Jones Indices

In the past few years, there has been a paradigm shift in the investment strategy adopted by market participants, wherein they are shifting from a strategy of short-term gain to one of long-term value creation.  Traditionally, market participants have considered publically available records like balance sheets, income statements, and annual reports to analyze the long-term value proposition of companies.  However, they have started to give importance to environmental, social, and governance (ESG) aspects when assessing companies’ long-term strategy for wealth creation.  Globally, ESG factors are considered a mainstream investment strategy.  Market participants now believe that the long-term financial sustainability and value creation of a company are dependent on how a company manages its ESG aspects in the long run.

Let us now discuss the components of ESG individually.

  • Environmental criteria analyze companies based on their policy on green technologies, climate change, greenhouse gas emissions, renewable or alternate energy sources, waste management, pollution control, water management, natural resource conservation, deforestation, Risks associated with these environmental aspects are looked into, and the company’s management of these risks is assessed.
  • Social criteria look at company policies regarding social factors like consumer protection, human rights, working conditions, health and safety measures, employee relations and diversity, etc. The nature of the business is also considered, as many market participants avoid businesses involved in alcohol, tobacco products, gambling, pornography, military, weapons, fossil fuels, and other industries they may not consider socially acceptable.
  • Governance criteria look at transparency in accounting methods, board independence, bribery, corruption, political party donations, executive compensation, disclosures under various regulations, rights of minority shareholders, etc.

ESG investments have matured globally, and many fund managers are tracking various ESG indices like the S&P 500® ESG Index, S&P Global 1200 ESG Index, etc.  Passive fund managers use ETFs or structured products that track an ESG index.  On the other hand, active fund managers depend on ESG scores to make active investment bets.  S&P Dow Jones Indices has partnered with RobecoSAM, a global specialist in sustainability investing, to provide ESG scores.

ESG investing in India is a new concept.  Some banks have issued green bonds that have been well received by market participants.  In the equity space, S&P BSE Indices has two indices in the sustainable investment space—the S&P BSE CARBONEX and S&P BSE GREENEX.  Traditionally, Indian companies have poor ESG disclosures compared with their global peers.  In recent years, some global market participants have pulled their investment from Indian companies because they did not comply with the international ESG standard benchmark.  However, this is undergoing a change, and both corporates and market participants have started to accept the importance of ESG factors in doing business.

ESG investing in India is expected to evolve and align itself with global market trends.  This shift is expected to gain momentum in the next few years in India, and more market participants will likely integrate ESG aspects into mainstream investment decisions, with the ultimate goal of long-term value creation.

The posts on this blog are opinions, not advice. Please read our Disclaimers.

SRI Community Stands Together

Contributor Image
Kelly Tang

Former Director

Global Research & Design

The SRI (Sustainable, Responsible, Impact Investing) conference took place recently in Denver, and it is a three-day conference that brings together asset owners, asset managers, and other investment professionals in the ESG, shareowner advocacy, and impact investing space. The conference is in its 27th year, and given that the conference took place in mid-November—right after the U.S. election results—a great deal of discussion centered on what will become of U.S. climate change policy under a Trump presidency.

The greatest concern was targeted on what the new administration will do in regard to the U.S. climate pledge made by the Obama administration at the COP 21 Paris agreement in December 2015 (see Exhibit 1). During his campaign, President-elect Trump had labeled climate change to be a hoax and vowed to undo the Paris agreement and back out of the USD 100 billion global climate fund to help poorer nations with climate change transition. However, in recent, post-election interviews, he has conceded that there is some connection between human activity and climate change and pledged to have an open mind toward the Paris agreement.

capture

Should the Trump administration ultimately decide to withdraw from the Paris agreement, there are a few different avenues to do so, and they can be pursued simultaneously. While the president cannot unilaterally cancel the Paris deal, he could begin the lengthy process of officially withdrawing the U.S. from the agreement, which is officially already in effect. The lengthiest option is the official withdrawal, which mandates that a country must wait three years to pull out, and once it makes that decision, it must wait another year to actually do so.

Option two would be to withdraw from the parent agreement, called the United Nations Framework Convention on Climate Change (UNFCCC), which has been in effect for 22 years. That agreement allows countries to withdraw with one year’s notice, automatically withdrawing them from any deals that are a subset of the UNFCCC, including the Paris accord. Option three would be easier and faster, but it would require the issuance of an executive order requesting the U.S. Senate to ratify the deal, which it is unlikely to do so.

Given that the new president-elect is moderating his viewpoints from some of the more controversial and polemic comments made during the campaign, what the new administration’s energy policy will shape up to be is a guessing game. For me, the lasting and most salient takeaway from the SRI conference was that the SRI community and its participants represent a formidable proponent who will continue to take action on climate change regardless of government administrations and differing policies. Some of the large asset managers have already joined the 360+ signatories of a new letter at lowcarbonusa.org calling on Trump for continued participation in the Paris agreement. In my next post, I will discuss how the SRI community has mobilized and become a powerful force to reckon with.

The posts on this blog are opinions, not advice. Please read our Disclaimers.

Plus ça change, plus c'est la même chose

Contributor Image
Fei Mei Chan

Former Director, Core Product Management

S&P Dow Jones Indices

This coming Sunday, December 4, 2016, a constitutional referendum will take place and the citizens of Italy will decide on a proposal by Prime Minister Matteo Renzi that, if passed, would mean major changes to Italy’s legislative system. The Prime Minister has stated his intent to resign if the “No” camp triumphs. The political stakes were nicely outlined in an article that appeared in today’s Wall Street Journal. On the same day, Austria will also be electing a new president. That it’s a presidential election rerun is only one indication of the political polarity there as well.

Political turmoil has been common in 2016 and we’ve seen how it has played out in market dynamics when the Brexit referendum and the U.S. presidential election took place. More elections are coming for countries in the Eurozone following those in Austria and Italy, notably the French presidential election. We often look at dispersion to understand better the dynamics of market volatility. The graph below charts the ratio of dispersion at the country level versus dispersion at the sector level for the S&P Eurozone BMI.

More often than not, country dispersion has been lower than sector dispersion, i.e., what you do matters more than where you are…and that continues to be the case for companies in the S&P Eurozone BMI. Despite all the heightened geopolitical drama in the Eurozone it has not translated to heightened risk levels in equity markets. This is corroborated by the muted volatility as indicated by the Euro STOXX 50® Volatility index. It seems the market, at least, doesn’t anticipate traumatic results.

plus-ca-change-plus-cest-la-meme-chose

plus-ca-change-plus-cest-la-meme-chose2

The posts on this blog are opinions, not advice. Please read our Disclaimers.

Base Metals Beat Precious Metals By Most In 26 Years

Contributor Image
Jodie Gunzberg

Former Managing Director, Head of U.S. Equities

S&P Dow Jones Indices

November was sandwiched between two eventful surprises, starting with the election and ending with OPEC’s agreement to cut output, that resulted in a month filled with big moves, mostly positive.  The Dow Jones Commodity Index (DJCI) Total Return for the month was 2.3%, bringing its year-to-date (YTD) total return to 11.8%.  The S&P GSCI Total Return for the month was 2.6%, bringing its YTD total return to 6.4%, on pace for its best year since 2009 and its first positive year since 2012.

Inside the S&P GSCI Total Return, 14 of 24 commodities were positive in November with the S&P GSCI Copper Total Return gaining 20.0%, its 7th best month in history since 1977 and its best month since April 2006.  One more single commodity that had a remarkably strong month is the S&P GSCI Feeder Cattle Total Return gaining 10.8%, marking its 3rd best month in history since 2002 and its best month since June 2011.   Also, the S&P GSCI Crude Oil Total Return gained 9.3% on the last day of November, posting its 14th best day ever since Jan. 2, 1987 and best day since Feb. 12, 2016. The S&P GSCI Cocoa Total Return lost 11.9% in November, making it the worst single commodity for the month.  Though gold was not the worst single commodity in November, the S&P GSCI Gold Total Return lost 8.0% that was its 18th worst month and worst month since June 2013.  

On a sector level, 3 of 5 were positive in November with the S&P GSCI Industrial Metals Total Return gaining 10.4% and the S&P GSCI Precious Metals Total Return losing 8.0%.  This is the greatest outperformance of industrial metals over precious metals in over 26 years, since March 1990.

Source: S&P SOw Jones Indices.

Interestingly, the last time the premium was as big in 1990, oil saw one of its biggest spikes in history that marked a bottom from oil.  While oil had as big as a spike this past Feb. that marked the bottom, these two spikes in the context of history happened relatively close together. While the S&P GSCI Total Return is recovered 26.5% from its bottom earlier this year, past recoveries have had much greater returns. For example the recovery in 1990, returned about 300%.

One concern remains about aggregate demand that would need to drive a true bull market for commodities.  The rise in copper alone does not necessarily indicate an economic recovery, but grains and gas tend to do well with Republican presidencies that can drive inflation.  It is possible that inflation from commodities may not coincide with gdp growth but if there is an increase in infrastructure growth that creates jobs then both copper and growth may rise.  The OPEC cut might mask sluggish demand in its price formation and also many miners have already cut spending that may be behind this spike in industrial metals.  From this it is possible supply is still the driving force in this recovery and whether it continues may hinge on demand in conjunction with macro factors like interest rates and the dollar.

The posts on this blog are opinions, not advice. Please read our Disclaimers.