Get Indexology® Blog updates via email.

In This List

Rieger Report: "Belly of the Curve" Good for Muni & Corporate Bonds

Rieger Report: High Yield Domination

Commodities Post Best September in Six Years

Rieger Report: Insured Munis Begin to Show Value

Rieger Report: Sector Driven Corporate Bond Returns

Rieger Report: "Belly of the Curve" Good for Muni & Corporate Bonds

Contributor Image
J.R. Rieger

Former Head of Fixed Income Indices

S&P Dow Jones Indices

Through October 3rd, the S&P Municipal Bond Index has returned 4.23% year-to-date and the S&P 500 Bond Index has returned 8.97%.  The 7 – 10 year maturity range has outpaced the overall benchmarks in both cases.

The average yield of bonds in the S&P 500 7-10 Year Investment Grade Corporate Bond Index has fallen by 94bps since year end as the yield thirsty market place has hunted yield oriented products.  As a result, the index has seen a year-to-date total return of 9.15%.

The 7 – 10 year range of the municipal bond market has kept pace with U.S. Treasury bonds and nominal yields remain comparable to U.S. Treasury bonds.  Meanwhile, taxable equivalent yields of the non-callable municipal bonds in that maturity range remain significantly higher and more in line with U.S. corporate bonds.  Municipal bonds are sensitive to new issue supply and retail investor sentiment which can change the yield relationships between municipals and other asset classes.

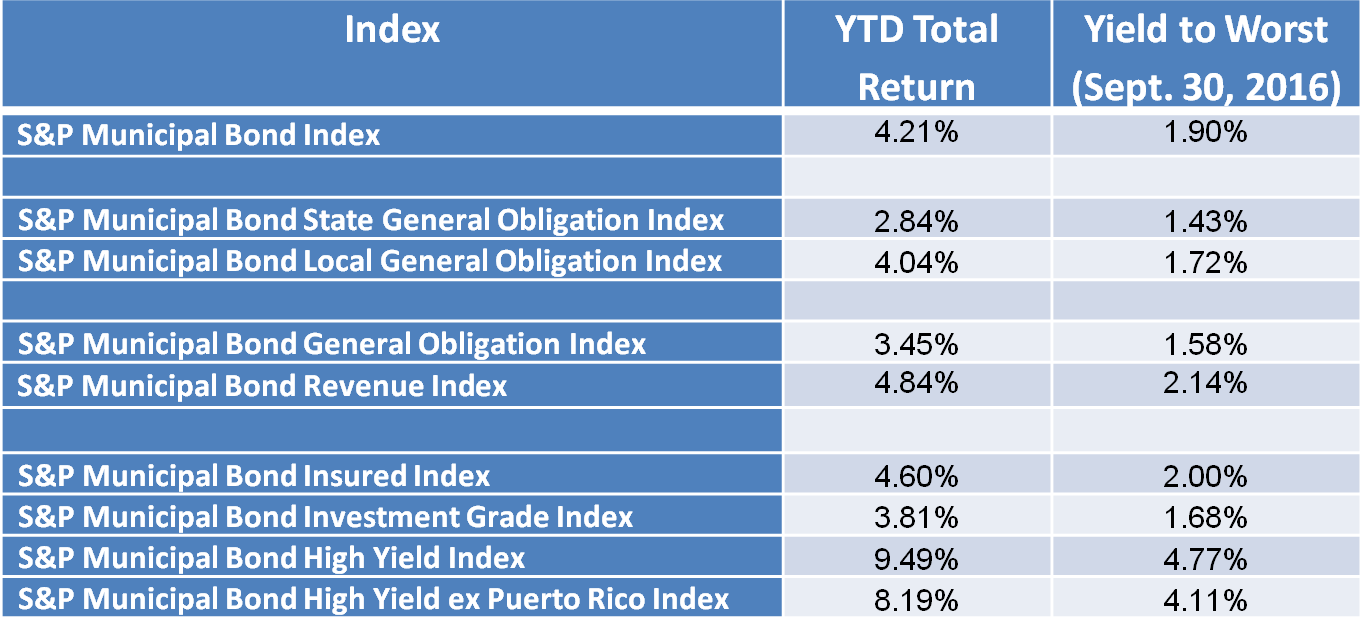
Table 1) Select indices, their year-to-date returns and yields as of October 3rd, 2016:

*Taxable Equivalent Yield assumes a 39.6% tax rate. Source: S&P Dow Jones Indices, LLC. Data as of October 3rd, 2016. Table is provided for illustrative purposes. It is not possible to invest directly in an index. Past performance is no guarantee of future results.

The posts on this blog are opinions, not advice. Please read our Disclaimers.

Rieger Report: High Yield Domination

Contributor Image
J.R. Rieger

Former Head of Fixed Income Indices

S&P Dow Jones Indices

High yield bonds have been marching along and putting up returns that are dominating the investment grade bond markets.

U.S. junk bonds continue to have no stink to them as demand for yield far outweighs the supply and seemingly the credit risks associated with these bonds.   The bonds of larger entities tracked in the S&P 500 High Yield Corporate Bond Index have returned 15.57% year-to-date modestly out performing the broader S&P U.S. High Yield Corporate Bond Index.  The S&P 500 High Yield Corporate Bond Index tracks the junk bonds of issuers of the S&P 500 and as the yields indicate, on average, they tend to be better quality than the bonds in the broader index.

Floating rate senior loans, as tracked by the S&P/LSTA U.S. Leveraged Loan 100 Index have returned over 8.5% year-to-date and are yielding just 110bps lower than fixed rate high yield bonds. Demand for yield combined with the benefits of floating rate interest payments and better security provisions than fixed rate junk bonds all helps to draw attention to this asset class.

High yield municipal bonds have also been in demand and also have benefited from a rally in Puerto Rico bonds. The S&P Municipal Bond High Yield Index, which includes Puerto Rico bonds has returned just about 9.5% year-to-date.  Without Puerto Rico bonds the index would have returned 8.19% year-to-date.

Table 1) Select indices, their year-to-date returns, yields and total market value as of September 30th, 2016:

Source: S&P Dow Jones Indices, LLC. Data as of September 30th, 2016. Table is provided for illustrative purposes. It is not possible to invest directly in an index. Past performance is no guarantee of future results.

The posts on this blog are opinions, not advice. Please read our Disclaimers.

Commodities Post Best September in Six Years

Contributor Image
Jodie Gunzberg

Former Managing Director, Head of U.S. Equities

S&P Dow Jones Indices

The S&P GSCI Total Return gained 4.1% in Sep., cutting the loss in the 3rd quarter to 4.2% and bring its year-to-date performance to 5.3%.  19 of 24 commodities were positive in Sep., from just 8 in Jul., the most to turn from negative to positive in two months since Jul. 2012. Energy gained 6.1%, making it the best performing sector and livestock performed worst of the sectors, losing 12.1%. The winning single commodity in Sep. was unleaded gasoline, gaining 11.4% and lean hogs lost 22.1%, the most of any commodity.

While the overall month was positive, the index was filled with extremes. Lean hogs and feeder cattle are having their 2nd worst months in history, the worst since Dec. 2003 and Aug. 2002, respectively.  This drove livestock to return its 7th worst month ever since Dec. 2003 when it lost 15.8%.  On the other hand, sugar and lead each posted 11.3% gains this month.

Adjusting for seasonality by looking only at historical months of Sep., while feeder cattle and lean hogs had their worst Sep. yet, it was the 3rd best ever for lead, 4th best for nickel and 5th best for aluminum, brent crude, gasoil, Kansas wheat and unleaded gasoline. It was also a strong Sep. in history for two sectors, agriculture posted its 6th best Sep. and industrial metals posted its 8th best Sep. Overall the S&P GSCI gained its first positive and best total return in Sep. since 2010, when it gained 8.5%.

Commodities are on pace to have several big winners and losers this year.  Thus far gold and zinc are set to have their 3rd best years in history while feeder cattle is set to post its worst year.  Below is a table of commodities that are closest to be on pace for record setting years. Although natural gas is having one of its best years, it is still negative – it has only ever been positive six times through the year at this point.

Source: S&P Dow Jones Indices

The S&P GSCI loses 74 basis points on average historically in the 4th quarter that is has been the worst performing quarter and is the only quarter that loses on average.  Energy is known to have its worst quarter at the end of the year but some commodities in industrial metals and agriculture perform at their best in the last quarter.  Since energy holds more weight and tends to drag other commodities down with it, only time (and fundamentals) will tell if commodities will end positive for the first year since 2012.

Source: S&P Dow Jones Indices


The posts on this blog are opinions, not advice. Please read our Disclaimers.

Rieger Report: Insured Munis Begin to Show Value

Contributor Image
J.R. Rieger

Former Head of Fixed Income Indices

S&P Dow Jones Indices

The S&P Municipal Bond Index has recorded a 4.21% year-to-date total return for the first three quarters of 2016 lagging the taxable corporate bond market returns of nearly 9% as tracked by the S&P 500 Bond Index.  Some segments of the municipal bond market are contributing more than others:

Table 1) Select municipal bond indices, their year-to-date returns and yields as of September 30th 2016

Source: S&P Dow Jones Indices, LLC.  Data as of September 30th, 2016. Table is provided for illustrative purposes. It is not possible to invest directly in an index. Past performance is no guarantee of future results.
Source: S&P Dow Jones Indices, LLC. Data as of September 30th, 2016. Table is provided for illustrative purposes. It is not possible to invest directly in an index. Past performance is no guarantee of future results.

The posts on this blog are opinions, not advice. Please read our Disclaimers.

Rieger Report: Sector Driven Corporate Bond Returns

Contributor Image
J.R. Rieger

Former Head of Fixed Income Indices

S&P Dow Jones Indices

Sector selection seems to be a major component of bond market returns in 2016.  On a total return basis the bonds of companies in the S&P 500 Index have been outperforming the stocks of those companies in 2016. A closer look reveals that as the yield starved market pushed yields down the higher yielding sectors of the bond markets have been what is driving the performance of the bond market.

Through the first three quarters of 2016, the S&P 500 Bond Index has seen a total return of over 8.9% year-to-date while the S&P 500 Index has returned over 7.8%.  The higher yielding sectors of Energy, Materials, Telecommunications and Utilities combine for a weight of 24% of the index and each sector has seen robust performance in  2016 so far,  The two leading sectors are the S&P 500 Energy Corporate Bond Index  returning over 16% year-to-date and the S&P 500 Materials Corporate Bond Index returning over 14%.

The drag on the corporate bond market is coming from the largest sector in the S&P 500 Bond Index, the Financials sector.  The S&P 500 Financials Corporate Bond Index, representing 25% of the index by market value has returned just over 6.25% year-to-date.

Table 1) Select indices, their returns and yields as of September 30th 2016:

*S&P 500 Real Estate Corporate Bond Index launched September 1st 2016. Source: S&P Dow Jones Indices, LLC.  Data as of September 30th, 2016. Table is provided for illustrative purposes. It is not possible to invest directly in an index. Past performance is no guarantee of future results.
*S&P 500 Real Estate Corporate Bond Index launched September 1st 2016. Source: S&P Dow Jones Indices, LLC. Data as of September 30th, 2016. Table is provided for illustrative purposes. It is not possible to invest directly in an index. Past performance is no guarantee of future results.

The posts on this blog are opinions, not advice. Please read our Disclaimers.