Get Indexology® Blog updates via email.

In This List

Rieger Report: Insured Munis Begin to Show Value

Rieger Report: Sector Driven Corporate Bond Returns

A long time coming: Real estate moves out from under the shadow of financials - Part 1

How a Negative Interest Rate Affected the Japanese Bond Market

Rieger Report: Mismatch - State Pension Short Falls & Muni Bond Market Returns

Rieger Report: Insured Munis Begin to Show Value

Contributor Image
J.R. Rieger

Former Head of Fixed Income Indices

S&P Dow Jones Indices

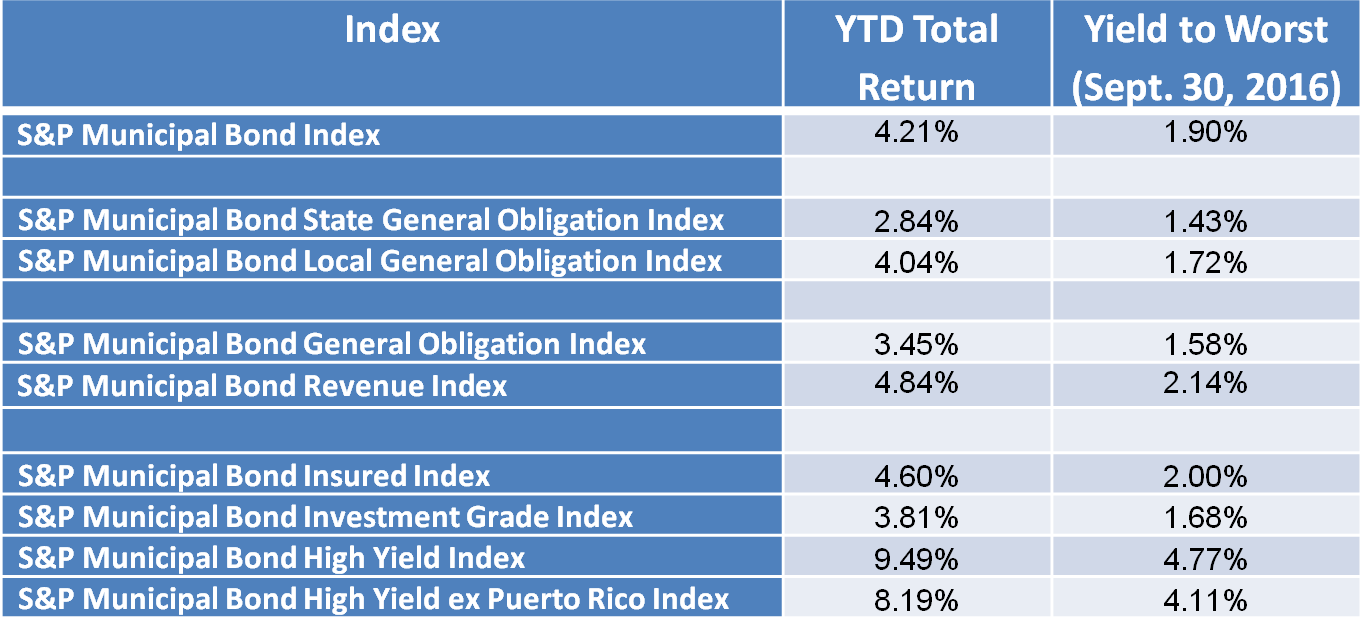
The S&P Municipal Bond Index has recorded a 4.21% year-to-date total return for the first three quarters of 2016 lagging the taxable corporate bond market returns of nearly 9% as tracked by the S&P 500 Bond Index.  Some segments of the municipal bond market are contributing more than others:

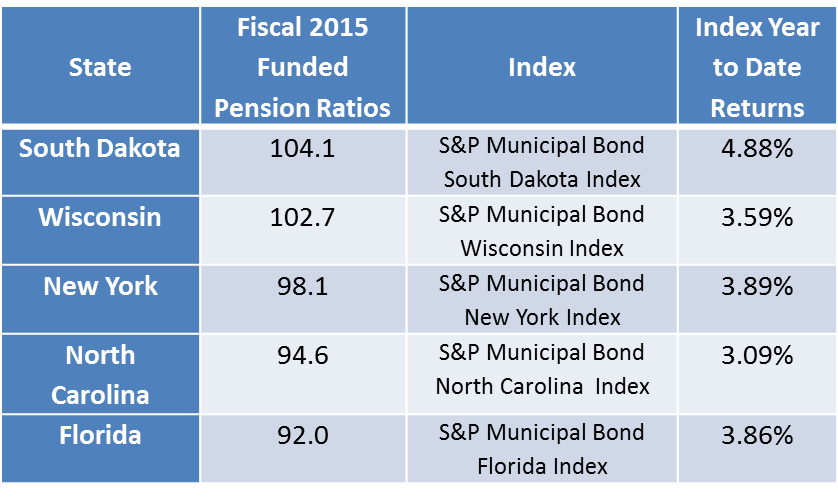
Table 1) Select municipal bond indices, their year-to-date returns and yields as of September 30th 2016

Source: S&P Dow Jones Indices, LLC.  Data as of September 30th, 2016. Table is provided for illustrative purposes. It is not possible to invest directly in an index. Past performance is no guarantee of future results.
Source: S&P Dow Jones Indices, LLC. Data as of September 30th, 2016. Table is provided for illustrative purposes. It is not possible to invest directly in an index. Past performance is no guarantee of future results.

The posts on this blog are opinions, not advice. Please read our Disclaimers.

Rieger Report: Sector Driven Corporate Bond Returns

Contributor Image
J.R. Rieger

Former Head of Fixed Income Indices

S&P Dow Jones Indices

Sector selection seems to be a major component of bond market returns in 2016.  On a total return basis the bonds of companies in the S&P 500 Index have been outperforming the stocks of those companies in 2016. A closer look reveals that as the yield starved market pushed yields down the higher yielding sectors of the bond markets have been what is driving the performance of the bond market.

Through the first three quarters of 2016, the S&P 500 Bond Index has seen a total return of over 8.9% year-to-date while the S&P 500 Index has returned over 7.8%.  The higher yielding sectors of Energy, Materials, Telecommunications and Utilities combine for a weight of 24% of the index and each sector has seen robust performance in  2016 so far,  The two leading sectors are the S&P 500 Energy Corporate Bond Index  returning over 16% year-to-date and the S&P 500 Materials Corporate Bond Index returning over 14%.

The drag on the corporate bond market is coming from the largest sector in the S&P 500 Bond Index, the Financials sector.  The S&P 500 Financials Corporate Bond Index, representing 25% of the index by market value has returned just over 6.25% year-to-date.

Table 1) Select indices, their returns and yields as of September 30th 2016:

*S&P 500 Real Estate Corporate Bond Index launched September 1st 2016. Source: S&P Dow Jones Indices, LLC.  Data as of September 30th, 2016. Table is provided for illustrative purposes. It is not possible to invest directly in an index. Past performance is no guarantee of future results.
*S&P 500 Real Estate Corporate Bond Index launched September 1st 2016. Source: S&P Dow Jones Indices, LLC. Data as of September 30th, 2016. Table is provided for illustrative purposes. It is not possible to invest directly in an index. Past performance is no guarantee of future results.

The posts on this blog are opinions, not advice. Please read our Disclaimers.

A long time coming: Real estate moves out from under the shadow of financials - Part 1

Contributor Image
Nick Kalivas

Senior Equity Product Strategist

Invesco

Real estate’s new sector status uncovers key differences between REITs and financial stocks

As of Sept. 1, S&P and MSCI have established real estate as the 11th sector within the Global Industry Classification Standard (GICS) by separating it from the financials sector. Under this arrangement, real estate investment trusts (REITs) are now classified as follows:

  1. Mortgage REITs are a sub-industry of the financials sector.
  2. All other REITs are classified as equity REITs and are classified as an industry under the real estate sector.

This move is expected to increase investor focus on the new real estate sector, which has offered unique return characteristics. As an example, REITs typically pay an above-market dividend yield. As of Aug. 31, 2016, the S&P 500 Real Estate Investment Trusts REITS Industry Index offered a dividend yield of 3.91%, compared with 2.13% for the S&P 500 Index.1

Financial stocks and REITs tend to behave differently

Separating real estate from financials make sense when you consider how they relate to each other. The following correlation matrix illustrates the relationship between different segments of the financials  sector relative to REITs, the VIX Index (a near-term indicator of market volatility), the 10-year Treasury yield, the S&P 500 Index, and the utility sector over a roughly eight-year period.

capture

Judging from these correlations, there are key differences between financial shares and real estate investment trusts.

  • Diversified financial stocks (S&P 500 Diversified Financials Industry Group Index) and insurance stocks (S&P 500 Insurance Select Industry Index) displayed the highest correlations to the 10-year Treasury yield; both like rising rates. By contrast, equity REITs (S&P 500 Real Estate Investment Trusts REITs Industry Index) displayed significantly lower correlation to the 10-year Treasury yield, while mortgage REITs (Dow Jones U.S. Mortgage REITs Index) displayed limited correlation to the 10-year Treasury yield.
  • Insurance stocks were most negatively correlated to market volatility, as represented by VIX, while mortgage REITs and equity REITs displayed the least negative correlation to VIX. This suggests that REITs could have a relatively defensive tilt compared with stocks in the financials sector. Typically, VIX rises during periods of uncertainty and weak equity prices.
  • Equity REITs had lower correlation to the S&P 500 Index than broader financials, such as banks, insurance companies and diversified financials. Mortgage REITs displayed the lowest correlation to the S&P 500 Index.
  • Banks (S&P 500 Banks Index) and diversified financials displayed a strong positive correlation to each other. In fact, they look related, from my viewpoint.
  • The relationship between equity REITs and utility stocks (S&P 500 Utilities Sector Index) is stronger than the relationship between REITs and other segments of the financials sector, such as banks, diversified financials, and insurance companies.

Clearly, there are significant differences between REITs and other segments of the financials sector, which may help explain some of the logic behind separating real estate from financials.

Stay tuned for part 2 of this series.

———————————————————————————

Important information
Correlation is the degree to which two investments have historically moved in relation to each other.
Dividend yield is the amount of dividends paid over the past year divided by a company’s share price.
Price ratio compares the price of one security (or basket or securities) to another security (or basket of securities). In this case, the prices of two indexes are compared.
A real estate investment trust (REIT) is a closed-end investment company that owns income-producing real estate.
Relative performance refers to the performance of an asset or investment relative to another asset, investment or benchmark.
The consumer price index (CPI) measures change in consumer prices as determined by the US Bureau of Labor Statistics.
The CBOE Volatility Index® (VIX®) is a key measure of market expectations of near-term volatility conveyed by S&P 500 stock index option prices. VIX is the ticker symbol for the Chicago Board Options
Exchange (CBOE) Volatility Index, which shows the market’s expectation of 30-day volatility.
The Dow Jones U.S. Mortgage REITs Index comprises real estate investment trusts, corporations or listed property trusts that are directly involved in lending money to real estate owners.
The S&P 500 Real Estate Investment Trusts REITS Industry Index defines and measures the investable universe of publicly traded real estate investment trusts domiciled in the United States.
The S&P 500 Utilities Sector Index is an unmanaged index considered representative of the utilities market.
The S&P 500 Financials Index comprises those companies included in the S&P 500 that are classified as members of the GICS® financials sector.
The S&P Banks Index comprises stocks in the S&P Total Market Index that are classified in the GICS asset management & custody banks, diversified banks, regional banks, other diversified financial services and thrifts & mortgage finance sub-industries.
The S&P Insurance Select Industry Index comprises stocks in the S&P Total Market Index that are classified in the GICS insurance brokers, life & health insurance, multi-line insurance, property and casualty insurance and reinsurance sub-industries.
The S&P 500® Index is an unmanaged index considered representative of the US stock market.
The S&P 500 Diversified Financials Industry Group Index is a capitalization-weighted index that is considered representative of the diversified financials industry group.
An investor cannot invest directly in an index.
Past performance is no guarantee of future results.
There are risks involved with investing in ETFs, including possible loss of money. Shares are not actively managed and are subject to risks similar to those of stocks, including those regarding short selling and margin maintenance requirements. Ordinary brokerage commissions apply. The Fund’s return may not match the return of the Underlying Index. The Fund is subject to certain other risks. Please see the current prospectus for more information regarding the risk associated with an investment in the Fund.
Investments focused in a particular industry or sector are subject to greater risk and are more greatly impacted by market volatility, than more diversified investments.
Investments in real estate related instruments may be affected by economic, legal, or environmental factors that affect property values, rents or occupancies of real estate. Real estate companies, including REITs or similar structures, tend to be small and mid-cap companies and their shares may be more volatile and less liquid.
Treasury securities are backed by the full faith and credit of the US government as to the timely payment of principal and interest.
Shares are not individually redeemable and owners of the Shares may acquire those Shares from the Fund and tender those Shares for redemption to the Fund in Creation Unit aggregations only, typically consisting of 50,000, 75,000, 100,000 or 200,000 Shares.
The information provided is for educational purposes only and does not constitute a recommendation of the suitability of any investment strategy for a particular investor. Invesco does not provide tax advice. The tax information contained herein is general and is not exhaustive by nature. Federal and state tax laws are complex and constantly changing. Investors should always consult their own legal or tax professional for information concerning their individual situation. The opinions expressed are those of the authors, are based on current market conditions and are subject to change without notice. These opinions may differ from those of other Invesco investment professionals.
NOT FDIC INSURED
 MAY LOSE VALUE
 NO BANK GUARANTEE
All data provided by Invesco unless otherwise noted.
Invesco Distributors, Inc. is the US distributor for Invesco Ltd.’s retail products and collective trust funds. Invesco Advisers, Inc. and other affiliated investment advisers mentioned provide investment advisory services and do not sell securities. Invesco Unit Investment Trusts are distributed by the sponsor, Invesco Capital Markets, Inc., and broker-dealers including Invesco Distributors, Inc. Each entity is an indirect, wholly owned subsidiary of Invesco Ltd. PowerShares® is a registered trademark of Invesco PowerShares Capital Management LLC, investment adviser. Invesco PowerShares Capital Management LLC (Invesco PowerShares) and Invesco Distributors, Inc., ETF distributor, are indirect, wholly owned subsidiaries of Invesco Ltd.
©2016 Invesco Ltd. All rights reserved.

The posts on this blog are opinions, not advice. Please read our Disclaimers.

How a Negative Interest Rate Affected the Japanese Bond Market

Contributor Image
Michele Leung

Former Director, Fixed Income Indices

S&P Dow Jones Indices

Since the Bank of Japan announced a negative interest rate policy earlier this year, both government and corporate bond yields have decreased (see Exhibit 1).  After hitting a record low yield of -0.23% on July 8, 2016, the S&P Japan Government Bond Index rebounded following a modest stimulus announcement later that month.  As of Sept. 29, 2016, the yield was hovering around -0.05%.  In terms of market size, growth of the Japanese government bond market has been steady in recent years; it expanded 5% YTD as of Sept. 29, 2016, and it increased by a multiple of four, to JPY 1,115 trillion, since the index was first valued in 1998.  The S&P Japan Government Bond Index rose 3.87% for the year as of the same date.

The yield of the S&P Japan Corporate Bond Index held up relatively well; it only tightened 16 bps YTD as of Sept. 26, 2016, to 0.22%.  Among all the sector-level subindices, the S&P Japan Utilities Bond Index had the highest yield, at 0.43%.  The market value of the Japanese corporate bond market stood at JPY 75 trillion, representing 6.3% of the overall bond market.  As for total return performance, the S&P Japan Corporate Bond Index gained 1.09% YTD as of Sept. 29, 2016.

The S&P Japan Bond Index is designed to track the performance of local-currency-denominated bonds issued by Japanese entities.  As of Sept. 29, 2016, it tracked close to 6,000 bonds, with a market value of approximately JPY 1,190 trillion.

Exhibit 1: Yield-to-Worst of the S&P Japan Bond Index, S&P Japan Government Bond Index, and S&P Japan Corporate Bond Index20160929

The posts on this blog are opinions, not advice. Please read our Disclaimers.

Rieger Report: Mismatch - State Pension Short Falls & Muni Bond Market Returns

Contributor Image
J.R. Rieger

Former Head of Fixed Income Indices

S&P Dow Jones Indices

S&P Global Ratings released a report on September 12th 2016 U.S. State Pensions: Weak Market Returns Will Contribute to Rise in Expense.  Importantly, the report identified the five worst and best funded state pensions.  You might think that an underfunded pension liability would mean the market would avoiding the municipal bonds issued by or within those states.  The market has determined otherwise.

Of the five states with the worst-funded pension ratios, three have outperformed the S&P Municipal Bond Index which has returned 4.16% year-to-date.   Limited supply of bonds and the ever present hunger for yield have a lot to do with the returns.

  • New Jersey, Illinois and Rhode Island municipal bonds started the year with impressive incremental yields over bonds from other states drawing attention from the yield starved market place.    As a result, the S&P Municipal Bond New Jersey Index has returned over 6% and the S&P Municipal Bond Illinois Index has returned over 5.1% year-to-date .
  • Kentucky has the worst-funded pension fund.  However, the lack of supply of bonds from Kentucky, including no state general obligation bonds,  keep any bonds from Kentucky in the sites of mutual funds seeking to further diversify away from the larger issuers.  The S&P Municipal Bond Kentucky Index has only modestly underperformed returning 3.88% year-to-date.

Table 1) Fiscal 2015 Five Worst-Funded Pension Ratios and Bond Returns (YTD)

Sources: S&P Global Ratings and S&P Dow Jones Indices, LLC. Data as of September 26, 2016. Table is provided for illustrative purposes. It is not possible to invest directly in an index. Past performance is no guarantee of future results.
Sources: S&P Global Ratings and S&P Dow Jones Indices, LLC.  Total return data as of September 26, 2016. Table is provided for illustrative purposes. It is not possible to invest directly in an index. Past performance is no guarantee of future results.

Bonds from only one of the five states with the best-funded pension ratios have outperformed the S&P Municipal Bond Index.  The S&P Municipal Bond South Dakota Index has seen a return of over 4.8% year-to-date with the lack of supply being a major factor.

Table 2) Fiscal 2015 Five Best-Funded Pension Ratios and Bond Returns (YTD)

Sources: S&P Global Ratings and S&P Dow Jones Indices, LLC. Data as of September 26, 2016. Table is provided for illustrative purposes. It is not possible to invest directly in an index. Past performance is no guarantee of future results.
Sources: S&P Global Ratings and S&P Dow Jones Indices, LLC. Total return data as of September 26, 2016. Table is provided for illustrative purposes. It is not possible to invest directly in an index. Past performance is no guarantee of future results.

Bottom line: supply and demand imbalances and yield hungry markets appear to be outweighing the fundamental factor of potential pension shortfalls.

Additional perspectives on this phenomenon in the municipal bond market are encouraged and welcomed.


The posts on this blog are opinions, not advice. Please read our Disclaimers.