VIX has spent the whole of August below 14, and remains – at time of writing – close to its lowest levels in two years. But the present calm may be dependent on a short-term seasonal effect; and we are approaching the traditional period where it ends.
August is traditionally a quiet month for U.S. equities. The usual deluge of corporate announcements, elections, and product launches attenuates to a trickle, while traders and investors decamp to their holiday destinations. Then, in September and throughout October, the world returns to business, sometimes only then announcing or processing events that may have occurred over the summer.
The lack of news flow in August and subsequent ramp-up creates a seasonal effect in volatility, with VIX depressed over the summer months and rising through late August and early September.
The graph below shows the historical extent of such seasonality, plotting the average level of VIX in comparison to its one year trailing average at each point in the year. The effect is not dominated by one or two outlier events, but instead appears persistent; the grey shaded area shows a similar pattern for the 25% and 75% percentile range of values. Today’s value is well below the historical interquartile range as VIX is 30% below its average level for the past year.
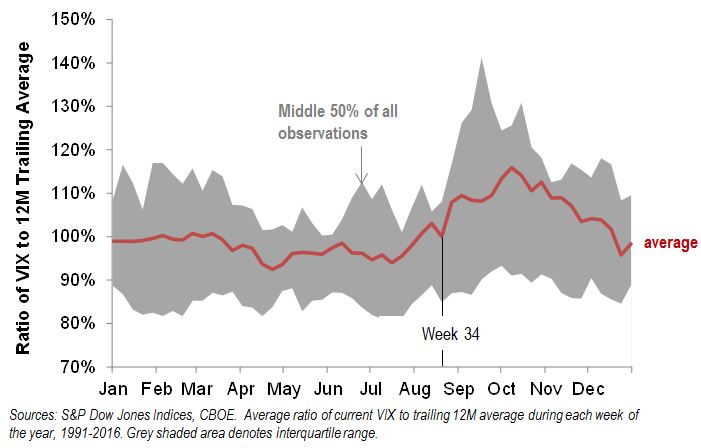
Interestingly, there is a clear seasonal lull between late June and early August, and a significant increase towards the end of August. The 35th week of the year showed, on average, the biggest rise in volatility. Given that we are presently approaching the end of the 34th week of 2016, investors might wish to bear this history in mind.
The posts on this blog are opinions, not advice. Please read our Disclaimers.