Get Indexology® Blog updates via email.

In This List

Performance Trends in the U.K. Gilt and Corporate Bond Markets

Introducing the CBLO Rate

Think Rates Will Stay Low? Consider Preferreds Over High Yield Bonds

Passive Investing can be good for your retirement and health

Asian Fixed Income: The Philippines After the Key Overnight Rate Cut

Performance Trends in the U.K. Gilt and Corporate Bond Markets

Contributor Image
Heather Mcardle

Director, Fixed Income Indices

S&P Dow Jones Indices

On Aug. 4, 2016, the Bank of England cut its benchmark rate by 25 bps to a low of 0.25%.  This move, coupled with its announcement of a GBP 70 billion expansion of quantitative easing, with GBP 10 billion committed for the purchase of investment-grade corporate bonds, is furthering the positive performance of these asset classes.  Quantitative easing is an asset-buying program that is meant to keep rates low to stimulate the economy.

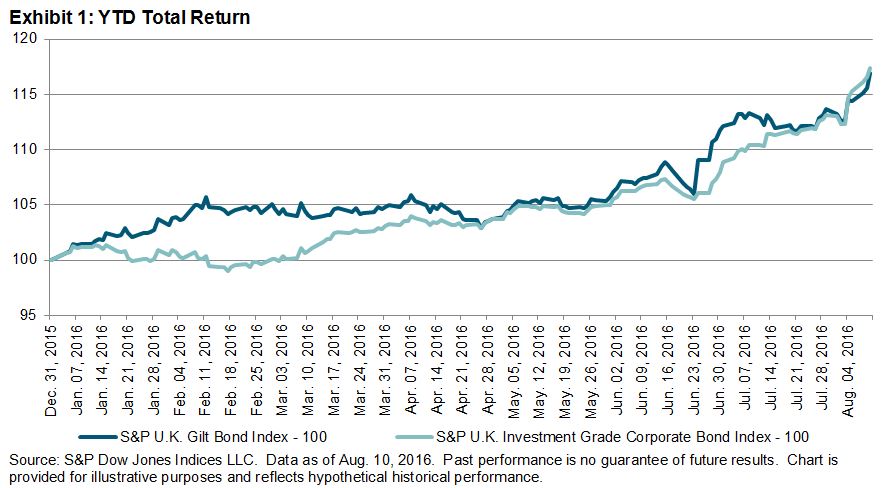
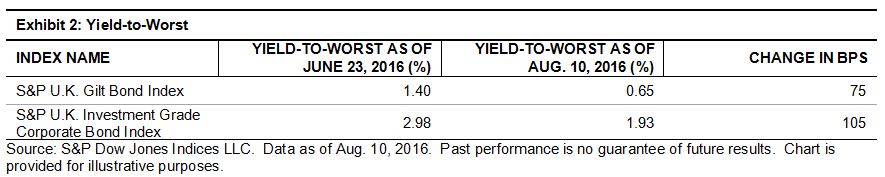
The S&P U.K. Gilt Bond Index had returned 16.93% YTD as of Aug. 10, 2016, while the S&P U.K. Investment Grade Corporate Bond Index came in at 17.32%.  Both of these asset classes continue to rally.  Since the vote for the Brexit on June 23, 2016, a rally based on flight to quality was largely expected for the U.K. gilt market, but the U.K. investment-grade corporate bond market has also has seen significant tightening of yields, despite concerns that a Brexit would negatively affect U.K. corporations.  Since the Brexit vote, the S&P U.K. Gilt Bond Index has tightened 75 bps and the S&P U.K. Investment Grade Corporate Bond Index has tightened 105 bps.

The question remains as to how much lower yields can go and how the Brexit will actually unfold.  Brexit impacts on the U.K. economy are starting to come in, with U.K. manufacturing output for Q2 2016 reversing its positive momentum and experiencing a sharp decline.

Capture

Capture

The posts on this blog are opinions, not advice. Please read our Disclaimers.

Introducing the CBLO Rate

Contributor Image
Mahavir Kaswa

Former Associate Director, Product Management

S&P BSE Indices

Bankers and corporate treasury managers may be facing the challenge of parking excess cash for a short period, maybe overnight, to earn some income or interest without compromising the security of the funds.  Similarly, there are many banks and corporates that need cash in the short term at the lowest possible rate.  While there are many possibilities (the call money market or repo market, commercial paper, etc.) each comes with certain advantages and disadvantages.  In India, various banks, financial institutions, and corporates are increasingly using the collateralized borrowing and lending obligation (CBLO) rate to lend or borrow money, for periods ranging from overnight up to one year (although the majority of trades are overnight).

What Is the CBLO Rate?

Unique to India, the CBLO rate facilitates the borrowing and lending of funds with G-sec as collateral.  It is also considered secure, as Clearing Corporation of India Ltd. (CCIL) is the central counterparty to all trades and guarantees settlement of CBLO trades.  Also, all trades are executed through electronic order book and are anonymous.  One of the distinguishing factors of CBLO is “tradability,” which means it allows the lender or borrower to reverse the position.  For example, in the case of a borrower, he can repay a loan before the expiry of the term.  It is no small wonder that CBLO has evolved as one of the most liquid money market instruments in India.

Currently, the collateralized market, CBLO, has become highly liquid and is dominating the short-term market in terms of volume of transactions.  Over the last eight years, the trading volume of CBLO segment has become higher than the combined trading volume of overnight call and market repo markets.  Exhibit 1 gives the historical trading volume of the short-term market in India.

Exhibit 1: Historical Trading Volume
Period Call CBLO Market Repo Overnight Total
2008 30,471 86,880 29,892 147,243
2009 22,287 140,748 47,193 210,228
2010 21,854 130,138 31,075 183,067
2011 28,490 118,978 27,473 174,941
2012 36,190 112,009 33,057 181,256
2013 34,871 166,962 50,370 252,203
2014 28,827 159,835 51,902 240,564
2015 27,739 164,823 63,998 256,561
Up to July 31, 2016 21,647 90,729 51,595 163,971

Source: Reserve Bank of India (www.rbi.org.in).  Data in INR billions.  Data as of July 31, 2016. Volume data is from Jan. 1, 2008, to July 31, 2016.

As CBLO is gaining popularity among banks, financial institutions, and corporates, it is difficult to know the returns generated by lenders by daily rolling of deposits in the CBLO market due to the lack of a transparent and rules-based benchmark.  With the launch of S&P BSE Liquid Rate Index, which is designed to measure the returns from a daily rolling deposit at the weighted average CBLO rates, we try to bridge this gap.  The index is calculated using the weighted average CBLO rate for transactions maturing on the following business day and with a settlement type T+0.

From Dec. 31, 2015 to July 31, 2016, the weighted average CBLO rate ranged from a low of 5.16% to a high of 7.36%.  However, the S&P BSE Liquid Rate Index had an annualized average return of 6.67% during the same period.

The posts on this blog are opinions, not advice. Please read our Disclaimers.

Think Rates Will Stay Low? Consider Preferreds Over High Yield Bonds

Contributor Image
Graham Day

Head of Product & Research

Elkhorn

As income seekers are forced to take additional risk to meet income needs in today’s near zero interest rate environment, preferreds may be considered over high yield bonds for the following five reasons:

1. Significantly higher credit quality
2. Comparable yields and lower volatility
3. Tax advantages on income
4. Call risk appears limited in near term for preferreds
5. Lower exposure to energy and oil drawdowns

Higher Credit Quality, Lower Volatility and Comparable Yields
Preferreds have significantly higher credit quality than high yield bonds, have exhibited lower volatility and can offer similar yields with potential tax advantages on income as some preferreds provide QDI.

Capture

Capture

Call Risk Appears Limited for Preferreds
Both preferreds and high yield bonds share call risk, though preferreds tend to have more callable issues. The analysis of the S&P U.S. Preferred Stock Index shows that if all preferreds at increased risk of being called are indeed called over the next three years, preferreds would lose approximately 17bps per year versus high yield. For yield-focused investors, the preferreds’ call risk appears insignificant.

Capture

Low Exposure to Energy – High Yield bonds continue to be heavily influenced by energy prices.
High yield has both direct and indirect exposure to energy and has been heavily influenced by oil’s extreme volatility. Preferreds have little to no exposure to energy and may help investors diversify their risk away from energy sensitive assets like high yield bonds.

Capture

Conclusion
Within the preferreds space, high quality, investment grade preferreds offer investors access to preferreds while providing unique exposure outside of banks or the UK as well as a defensive tilt to hedge against down markets. In summary, preferreds appear well positioned against high yield bonds for investors looking for a combination of higher yields and lower risks.

Capture

The posts on this blog are opinions, not advice. Please read our Disclaimers.

Passive Investing can be good for your retirement and health

Contributor Image
Michael Mell

Global Head of Custom Indices

S&P Dow Jones Indices

In the print edition of the Wall Street Journal this weekend, there were two unrelated stories side by side, one about a firm’s self-dealing with 401(k) and another about Medicare.  After reading them together it became clear that these seeming unrelated stories unintentionally show that while active funds can be bad for your retirement and health, passive investing can be good for your retirement and health.  Let me explain.

In “Self-Dealing With 401(k),” we find an unhappy plan participant pointing out that one of the active funds offered by the plan had abysmal performance.  For the five years up until June 30, 2016, it posted an annual return of 4.7% versus 12.1% for its benchmark, the S&P 500.  To add insult to injury, the story reports that the expense ratio of this poorly performing active fund (0.8%) is far higher than an institutional index fund that tracks the S&P 500 (0.02%).  In the suit filed by this plan participant, the complaint says “plan participants would have had USD 130 million more had they instead been in an index fund that roughly matched the market.” That’s a decent amount of money that could have helped out with those participants’ retirement.

The next story about Medicare (arguably a topic many retirees care about), Laura Saunders discusses how many high-income Americans will be subject to increases in premium charges and the key number for planning is the modified, adjusted, gross income (AGI), which usually means a person’s adjusted gross income.  The higher it is, the more some will pay for Medicare.  So her piece goes into detail about how to keep one’s AGI down using charitable contributions, Roth IRAs, timing the receipt of income, etc., but it’s under the managing capital gains and losses section where we find this key observation, “passive investments such as broad-based index funds tend to pay out less annually in capital gains” and it’s taxable capital gains that can raise an AGI.

Were these two pieces intentionally published side by side in the print edition?  Probably not because I don’t think the authors thought someone from the indexing industry would see that taken together, both stories created a real and tangible case study for those thinking about retirement and Medicare to embrace passive investing as way to better prepare themselves.  Lest this observation be taken as merely anecdotal evidence, I will conclude by pointing out “that within domestic equity, the majority of managers in nearly every category underperformed their respective benchmarks over the five-year horizon, for both retail funds and institutional accounts.”


The posts on this blog are opinions, not advice. Please read our Disclaimers.

Asian Fixed Income: The Philippines After the Key Overnight Rate Cut

Contributor Image
Michele Leung

Former Director, Fixed Income Indices

S&P Dow Jones Indices

The Central Bank of the Philippines unexpectedly lowered the key overnight rate to 3% from 4% on June 3, 2016, as it shifted to an interest rate corridor system to “improve the transmission of monetary policy.”[1]  Sovereign bonds have had a strong rally since then; the total return rose 10.82% YTD, while the yield-to-maturity tightened 103 bps to 3.21%, according to the S&P Philippines Sovereign Bond Index as of Aug. 4, 2016.

The S&P Philippines Government Bond Index, which seeks to track the performance of sovereign bonds, government bills, and agency bonds, rose 10.58% in the same period.  Government bonds represent 89% of the overall fixed income market in the Philippines, with a total market value of PHP 4.3 trillion.

Additionally, the corporate bond market grew steadily over the 10-year period ending Aug. 4, 2016.  The three biggest corporate issuers are Ayala Land, Ayala Corp, and SM Prime Holdings.  Though the yield-to-maturity of the S&P Philippines Corporate Bond Index tightened 79 bps to 4.08% YTD, the yields remained attractive for the modified duration, at 4.06%.

The S&P Philippines Bond Index was the second outperformer YTD among the 10 Pan-Asian countries, delivering a 10.08% YTD total return as of Aug. 4, 2016.  The S&P Indonesia Bond Index was the best performer and gained 16.19% during the same period.

The Central Bank of the Philippines kept its benchmark interest rate unchanged on June 23, 2016, while indicating that average inflation is likely to settle near the lower edge of the inflation target of 2%-4% this year.  The next scheduled interest rate decision will be on Aug. 11, 2016.

Exhibit 1: The S&P Philippines Bond Index, S&P Philippines Government Bond Index, and S&P Philippines Corporate Bond Index 2016 YTD Total Return

20160809a

[1] Source: Bangko Sentral ng Pilipinas (BSP). Data as of May 16, 2016. http://www.bsp.gov.ph/publications/media.asp?id=4063

The posts on this blog are opinions, not advice. Please read our Disclaimers.