Get Indexology® Blog updates via email.

In This List

Remember Inflation

Here's One Reason Drivers Should Be Happy

Bouncing Off Brexit

Indicizing Income

How Benchmark Selection Can Support a Retirement Plan’s IPS

Remember Inflation

Contributor Image
David Blitzer

Former Managing Director and Chairman of the Index Committee

S&P Dow Jones Indices

This morning’s CPI report for June looked like the last few reports showing inflation at about one percent in the last 12 months. However, beneath the surface things are shifting around and giving hints that a year from now prices could be noticeably higher than they are today. A modest rise in inflation over the next year or so shouldn’t be a surprise. Current economic conditions can support higher prices: the economy is expanding, unemployment is down and consumers are confident and spending money. The current low levels of inflation are due to the strong dollar, falling food prices and formerly falling energy prices.

The “core CPI,” the index excluding the volatile food and energy segments, is a good way to understand inflation. The first chart shows 20 years of the total CPI in red and the core CPI in blue, both series measured as the percentage change over the previous 12 months.  The overall CPI in red gyrates up and down, largely driven by the surges and collapses in oil prices in recent years while the blue line reveals more gentle movements. In recent months both are rising.

In the year ended in June 2016, the overall CPI rose 2.3%; the food component was up 0.3% and the energy component was down 9.4%. Today falling energy prices are keeping inflation down. However, falling energy and oil prices may be a thing of the past. Oil rebounded from its lows. Even if oil and energy prices stay where they are, overall inflation will rise. The second chart shows the overall CPI (blue bars) and WTI oil (red line). As seen there, after oil prices peaked in 2014, inflation reversed and began to climb in 2015. When oil rose earlier this year, inflation rose along with it.

No one expects a rapid return to double digit inflation. However, the days when everyone assumed inflation would be zero forever maybe ending.  In a growing economy when businesses and consumers are less resistant to attempts to raise prices, higher prices eventually stick.

The posts on this blog are opinions, not advice. Please read our Disclaimers.

Here's One Reason Drivers Should Be Happy

Contributor Image
Jodie Gunzberg

Former Managing Director, Head of U.S. Equities

S&P Dow Jones Indices

As summer gets underway, there are some commodities that do seasonally well during this time of year.   The one that historically does best in the summer is unleaded gasoline with an average historical third quarter return of 8.2%.  This is not surprising from the increased demand from summer driving as people vacation.  However, the prices are now falling rather than rising which only happens every one of three years.  In fact, the S&P GSCI Unleaded Gasoline has now hit its lowest July levels since 2004 and the total return is having its second worst third quarter start in history since 1988, losing 5.9%, with only 2009 falling faster when it dropped 13.5% in the first nine trading days.

Unleaded gasoline

The stronger dollar and stagnant interest rates aren’t helping commodities but individual commodity fundamentals are more powerful.  Both the International Energy Agency (IEA) and Energy Information Agency (EIA) released reports yesterday that drove oil down on global supply (according to IEA) and US supply (according to EIA).  On June 24, after the Brexit vote oil dropped the most in one day -4.9% since Feb., and since then, there have been two other big down days with yesterday being the third. It certainly questions whether the modest demand deceleration globally as forecasted by the IEA may lengthen the oil rebalance.

On the flip side, cotton, nickel and aluminum are typically the worst in the summer and are having a great start to q3, up 15.2%, 9.6% and 1.6%, respectively. Nickel is increasing from environmental licenses potentially impacting supply. Cotton is rising from the drought impacting supplies in India, and according to their government, inventory could be cut by 1/3 bringing output to the lowest in six years.  Aluminum is up slightly from anticipated automobile growth in China, which could grow more if gasoline prices stay low.

The posts on this blog are opinions, not advice. Please read our Disclaimers.

Bouncing Off Brexit

Contributor Image
Craig Lazzara

Former Managing Director, Index Investment Strategy

S&P Dow Jones Indices

After yesterday’s record close for the S&P 500, memories of last month’s Brexit panic seem far away.  (In fact the U.K. referendum to leave the European Union took place only 19 days ago as of this writing.)  In the immediate aftermath of the referendum, global markets fell sharply, while low volatility indices mitigated the impact of the decline.  The crisis, if we may call it that, was short-lived.  The U.K. referendum took place on a Thursday, markets fell for the next two trading days, and then bottomed on Monday June 27.

Low volatility indices attenuate the returns of their parents in both directions.  They typically decline less when the market goes down, but rise less when the market goes up.  Since June 27, in fact, they have lagged their cap-weighted counterparts, as illustrated below for the S&P 500:

500 Low Vol through 11 July

From June 27 to July 11, the S&P 500’s total return was 6.9%, well ahead of S&P 500 Low Vol’s 5.5%.  Notice, though, that since the beginning of June, Low Vol has significantly outperformed the S&P 500.  Even though it lags on the upside, the cushion that Low Vol provides on the downside can make for attractive compound returns over time.

This effect is not limited to large-cap U.S. stocks:

Low Vol through 11 July

Even with the market at all-time highs, low volatility’s performance continues to be attractive.

The primary determinant of the relative performance of low volatility is the return pattern of its parent index.  If the S&P 500 goes up 30% next year, S&P 500 Low Vol is highly likely to lag far behind, and the opposite is true if the market declines significantly.  In that sense, predicting the relative performance of Low Vol is tantamount to predicting the direction of the market as a whole.  Some fortunate souls may have the key to that puzzle, but we are not among them.

What we can say is that low volatility’s performance is typically characterized by protection from the worst of downside moves and participation in market rallies.  Neither the protection nor the participation are perfect — but for the investor who’s willing to forgo some upside in exchange for a smoother downside, low volatility can provide a congenial pattern of returns.


The posts on this blog are opinions, not advice. Please read our Disclaimers.

Indicizing Income

Contributor Image
Craig Lazzara

Former Managing Director, Index Investment Strategy

S&P Dow Jones Indices

This morning’s Wall Street Journal described one aspect of the “Brave New World” occasioned by ultra-low (or negative) interest rates:

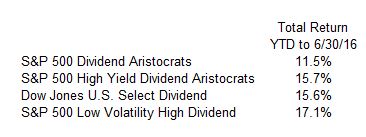
Tellingly, strategists at Citigroup have created a basket of stocks for what they call “bond refugees”—investors who want yield but without the big swings in prices associated with equities. To do so, they looked for stocks with high dividend yields, but that fall by relatively less in price when markets take a tumble. That produced a list of large, defensive, global stocks, including PepsiCo, NestléRoche and McDonald’s. The strategy produced a total return of 8.2% in the first half…

8.2% is an impressive total return for the first half of 2016, well above the S&P 500’s 3.84%.  But of course, the strategists in question weren’t trying to beat the S&P 500, they were trying to find stocks with high yields and relatively stable prices.  Could we indicize high yield and stable prices?  Indeed, there are a number of indices that aim to do exactly that:

Indicized income to 063016

When we speak of “indicizing,” we mean to provide, in passive form, a strategy formerly available only via active management.  As this simple example shows, high yield equity strategies can be readily indicized.  Investors who opt for passive, indicized strategies can count on transparency, reliability, and low cost.  They might also (as in today’s example) achieve better performance.

The posts on this blog are opinions, not advice. Please read our Disclaimers.

How Benchmark Selection Can Support a Retirement Plan’s IPS

Contributor Image
Philip Murphy

Former Managing Director, Global Head of Index Governance

S&P Dow Jones Indices

Sponsors of 401(k) plans sometimes do not approach the selection of capital market benchmarks as if it has a significant role to play in the implementation of their investment policy statements (IPSs).  They may leave benchmark selection to investment managers, consultants, or service providers, but in so doing they may be missing an opportunity to enhance plan oversight and administration.

According to Ian Kopelman, Chair of the Employee Benefits and Executive Compensation Practice at DLA Piper, an IPS of defined contribution retirement plans ought to include several key elements.[1]  Among them are the following.

  • Describe the purposes and general investment objectives of the plan: Fulfillment of a plan’s purpose is interconnected with its investment objectives, which in turn should be measured against appropriate capital market-based benchmarks. For example, if a plan aspires to provide default investment options that transition from wealth accumulation to income risk mitigation, then such an investment strategy ought to be measured against an appropriate benchmark.
  • Describe the asset classes to be offered and the factors for selecting investment options, such as risk/return characteristics, expenses, and benchmark comparisons: Multi-asset class investment products, such as target date and balanced funds, are now the most widely adopted default solutions within 401(k) plans. These products typically have a mandate to deliver full-fledged investment programs that cannot be robustly measured against single asset class benchmarks.  It is more important than ever to develop a methodical framework to benchmark selection in light of the dynamic, complex nature of modern default investment alternatives.
  • Describe standards for investment performance and criteria for measuring performance: One of the deeper issues around investment performance is benchmark appropriateness. Too often, a great deal of time and energy is spent on performance analytics, but a lack of benchmark due diligence results in flawed analysis.  In other words, an IPS can describe standards and criteria for investment performance, but if a selected benchmark is not appropriate for the investment strategy, the analysis is flawed from the outset.
  • Describe the process and standards for selecting a qualified default investment alternative (QDIA): No other investment selection has as much potential impact on a plan’s participant population as the QDIA choice. So it is singularly important to select an appropriate benchmark for the QDIA.  Within the overall target date category, the S&P Target Date Indices offer industry-wide benchmarks that represent a consensus view of target date managers.  S&P DJI offers the static S&P Target Risk Indices that may serve well as benchmarks for balanced funds.  For target date income funds, a new category that seeks a transition and a balance between growth and the mitigation of income affordability risk, the S&P STRIDE Indices may serve well as the benchmark of choice.

Far from being merely incidental in the investment monitoring process, benchmarks play a vital role in the implementation of a retirement plan’s IPS.  However, for their true value to be realized, a thoughtful approach to benchmark selection is essential.

[1] See “Investment Policy Statements: Think Art, Not Science” at http://dimensional.com/media/350682/3-Investment-Policy-Statements.pdf

The posts on this blog are opinions, not advice. Please read our Disclaimers.