Get Indexology® Blog updates via email.

In This List

Bouncing Off Brexit

Indicizing Income

How Benchmark Selection Can Support a Retirement Plan’s IPS

Looking at the Low Beta and Value Legs of the S&P GIVI® Japan

Asian Fixed Income: Sovereign Yields

Bouncing Off Brexit

Contributor Image
Craig Lazzara

Former Managing Director, Index Investment Strategy

S&P Dow Jones Indices

After yesterday’s record close for the S&P 500, memories of last month’s Brexit panic seem far away.  (In fact the U.K. referendum to leave the European Union took place only 19 days ago as of this writing.)  In the immediate aftermath of the referendum, global markets fell sharply, while low volatility indices mitigated the impact of the decline.  The crisis, if we may call it that, was short-lived.  The U.K. referendum took place on a Thursday, markets fell for the next two trading days, and then bottomed on Monday June 27.

Low volatility indices attenuate the returns of their parents in both directions.  They typically decline less when the market goes down, but rise less when the market goes up.  Since June 27, in fact, they have lagged their cap-weighted counterparts, as illustrated below for the S&P 500:

500 Low Vol through 11 July

From June 27 to July 11, the S&P 500’s total return was 6.9%, well ahead of S&P 500 Low Vol’s 5.5%.  Notice, though, that since the beginning of June, Low Vol has significantly outperformed the S&P 500.  Even though it lags on the upside, the cushion that Low Vol provides on the downside can make for attractive compound returns over time.

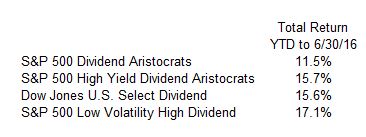
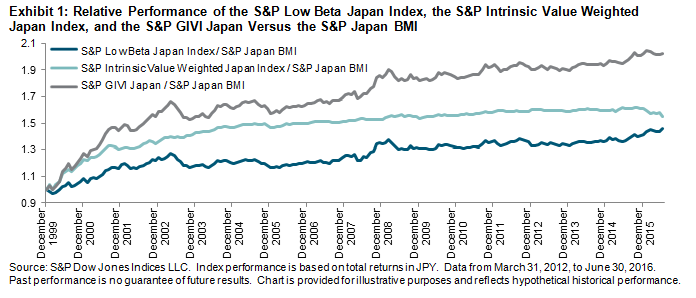
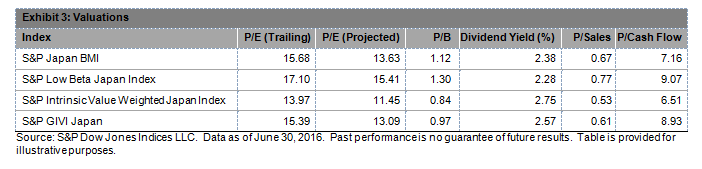
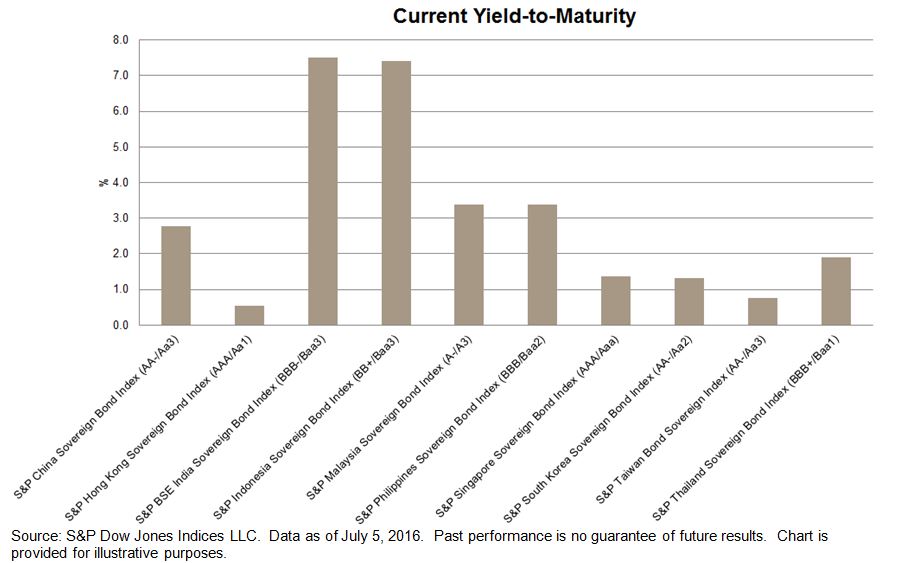
This effect is not limited to large-cap U.S. stocks:

Low Vol through 11 July

Even with the market at all-time highs, low volatility’s performance continues to be attractive.

The primary determinant of the relative performance of low volatility is the return pattern of its parent index.  If the S&P 500 goes up 30% next year, S&P 500 Low Vol is highly likely to lag far behind, and the opposite is true if the market declines significantly.  In that sense, predicting the relative performance of Low Vol is tantamount to predicting the direction of the market as a whole.  Some fortunate souls may have the key to that puzzle, but we are not among them.

What we can say is that low volatility’s performance is typically characterized by protection from the worst of downside moves and participation in market rallies.  Neither the protection nor the participation are perfect — but for the investor who’s willing to forgo some upside in exchange for a smoother downside, low volatility can provide a congenial pattern of returns.


The posts on this blog are opinions, not advice. Please read our Disclaimers.

Indicizing Income

Contributor Image
Craig Lazzara

Former Managing Director, Index Investment Strategy

S&P Dow Jones Indices

This morning’s Wall Street Journal described one aspect of the “Brave New World” occasioned by ultra-low (or negative) interest rates:

Tellingly, strategists at Citigroup have created a basket of stocks for what they call “bond refugees”—investors who want yield but without the big swings in prices associated with equities. To do so, they looked for stocks with high dividend yields, but that fall by relatively less in price when markets take a tumble. That produced a list of large, defensive, global stocks, including PepsiCo, NestléRoche and McDonald’s. The strategy produced a total return of 8.2% in the first half…

8.2% is an impressive total return for the first half of 2016, well above the S&P 500’s 3.84%.  But of course, the strategists in question weren’t trying to beat the S&P 500, they were trying to find stocks with high yields and relatively stable prices.  Could we indicize high yield and stable prices?  Indeed, there are a number of indices that aim to do exactly that:

Indicized income to 063016

When we speak of “indicizing,” we mean to provide, in passive form, a strategy formerly available only via active management.  As this simple example shows, high yield equity strategies can be readily indicized.  Investors who opt for passive, indicized strategies can count on transparency, reliability, and low cost.  They might also (as in today’s example) achieve better performance.

The posts on this blog are opinions, not advice. Please read our Disclaimers.

How Benchmark Selection Can Support a Retirement Plan’s IPS

Contributor Image
Philip Murphy

Former Managing Director, Global Head of Index Governance

S&P Dow Jones Indices

Sponsors of 401(k) plans sometimes do not approach the selection of capital market benchmarks as if it has a significant role to play in the implementation of their investment policy statements (IPSs).  They may leave benchmark selection to investment managers, consultants, or service providers, but in so doing they may be missing an opportunity to enhance plan oversight and administration.

According to Ian Kopelman, Chair of the Employee Benefits and Executive Compensation Practice at DLA Piper, an IPS of defined contribution retirement plans ought to include several key elements.[1]  Among them are the following.

  • Describe the purposes and general investment objectives of the plan: Fulfillment of a plan’s purpose is interconnected with its investment objectives, which in turn should be measured against appropriate capital market-based benchmarks. For example, if a plan aspires to provide default investment options that transition from wealth accumulation to income risk mitigation, then such an investment strategy ought to be measured against an appropriate benchmark.
  • Describe the asset classes to be offered and the factors for selecting investment options, such as risk/return characteristics, expenses, and benchmark comparisons: Multi-asset class investment products, such as target date and balanced funds, are now the most widely adopted default solutions within 401(k) plans. These products typically have a mandate to deliver full-fledged investment programs that cannot be robustly measured against single asset class benchmarks.  It is more important than ever to develop a methodical framework to benchmark selection in light of the dynamic, complex nature of modern default investment alternatives.
  • Describe standards for investment performance and criteria for measuring performance: One of the deeper issues around investment performance is benchmark appropriateness. Too often, a great deal of time and energy is spent on performance analytics, but a lack of benchmark due diligence results in flawed analysis.  In other words, an IPS can describe standards and criteria for investment performance, but if a selected benchmark is not appropriate for the investment strategy, the analysis is flawed from the outset.
  • Describe the process and standards for selecting a qualified default investment alternative (QDIA): No other investment selection has as much potential impact on a plan’s participant population as the QDIA choice. So it is singularly important to select an appropriate benchmark for the QDIA.  Within the overall target date category, the S&P Target Date Indices offer industry-wide benchmarks that represent a consensus view of target date managers.  S&P DJI offers the static S&P Target Risk Indices that may serve well as benchmarks for balanced funds.  For target date income funds, a new category that seeks a transition and a balance between growth and the mitigation of income affordability risk, the S&P STRIDE Indices may serve well as the benchmark of choice.

Far from being merely incidental in the investment monitoring process, benchmarks play a vital role in the implementation of a retirement plan’s IPS.  However, for their true value to be realized, a thoughtful approach to benchmark selection is essential.

[1] See “Investment Policy Statements: Think Art, Not Science” at http://dimensional.com/media/350682/3-Investment-Policy-Statements.pdf

The posts on this blog are opinions, not advice. Please read our Disclaimers.

Looking at the Low Beta and Value Legs of the S&P GIVI® Japan

Contributor Image
Tianyin Cheng

Former Senior Director, ESG Indices

S&P Dow Jones Indices

The spread between the returns of the S&P GIVI Japan and its benchmark index, the S&P Japan BMI, comes from three sources: the excess return of the S&P Low Beta Japan Index; the excess return of the S&P Intrinsic Value Weighted Japan Index; and a residual effect that comes from the sequential approach to the index’s construction.  Looking at the low beta and value legs individually may help market participants to understand the performance of the S&P GIVI Japan better.

Performance

The S&P Low Beta Japan Index and the S&P Intrinsic Value Weighted Japan Index outperformed the S&P Japan BMI by 2.42% and 2.79%, respectively, over the period from Dec. 31, 1999, to June 30, 2016.  Over that time period, however, there were cycles in the performance of the two legs and the correlation coefficient.

Exhibit 1 provides a visual illustration of the relative performance of the two legs versus the S&P Japan BMI.  The value premium seems to be compressed in Japan over time.  We see for the first time in June 2016 that the S&P Intrinsic Value Weighted Japan Index underperformed the S&P Japan BMI over a rolling five-year period.  The low beta leg tended to outperform during down markets and underperform during up markets.  In the bull markets from 2H 2012 to 1H 2015, however, the low beta leg had a counterintuitively strong performance.  The low beta leg continued to do well when Japanese equity markets were down, starting from 2H 2015.

Please refer to S&P GIVI Japan and Major Single Factors from July 2016 for a performance analysis since the launch of the indices.

Capture

Correlation

Exhibit 2 shows the rolling three-year correlation coefficient between the two legs.  The full period correlation coefficient between the two legs is 0.35.  Over the seven-year period ending June 30, 2016, there seems to have been a much lower correlation (-0.15).  Given the performance of these two legs since end of 2012, the correlation between them has declined dramatically.  As of June 30, 2016, the correlation was at -0.54, the lowest level since the end of 1999.

Capture

Valuation

The recent performance also significantly pushed up the valuation of the S&P Low Beta Japan Index.  As shown in Exhibit 3, the S&P Low Beta Japan Index was priced at 15.41x projected earnings and 1.30x book value as of June 30, 2016.  This was much higher than the 13.63x and 1.12x, respectively, of the benchmark, the S&P Japan BMI.  We should note that the valuation of the S&P GIVI Japan was still more favorable compared with the benchmark.

Capture

The posts on this blog are opinions, not advice. Please read our Disclaimers.

Asian Fixed Income: Sovereign Yields

Contributor Image
Michele Leung

Former Director, Fixed Income Indices

S&P Dow Jones Indices

The story of Asian fixed income remains compelling, and select Asian bond markets recorded strong growth and solid performance in 2016.  Most Asian currencies strengthened with the news of the Brexit, which may further improve sentiment among market participants.  Asian bond yields, though tightened, are still at an elevated level compared with their global peers.  Particularly in this global low-to-negative interest rate environment, Asian bonds are attractive, as the theme of yield hunting continues.

Looking into the 10 countries in the S&P Pan Asia Sovereign Bond Index, the highest-yielding market was India (at 7.50%), followed by Indonesia (at 7.40%), see exhibit 1.  In fact, the S&P Indonesia Bond Index was the outperformer in the region in 1H 2016, delivering 12.90% total return YTD as of July 7, 2016.  The S&P BSE India Bond Index gained 5.99% during the same period.

The yield-to-maturity of the S&P China Bond Index was 2.79%; it was the highest among the Asian countries rated ‘AA-.’  Yet the total return index only added 1.73% YTD, making it the second–worst-performing country in the Pan Asia region.

The S&P Hong Kong Bond Index was the underperformer, as it was up 0.67% YTD.  Its sovereign yield was 0.53%, which also the lowest among the 10 countries.

Exhibit 1: Asian Sovereign Yields

20160711

The posts on this blog are opinions, not advice. Please read our Disclaimers.