The S&P Canada Aggregate Bond Index offers an investable way to participate in a broad index that is designed to measure the performance of the Canadian market. The index is made up of the following fixed income product groups (see Exhibit 1).
Exhibit 1: S&P Canada Aggregate Bond Index and its Subindices
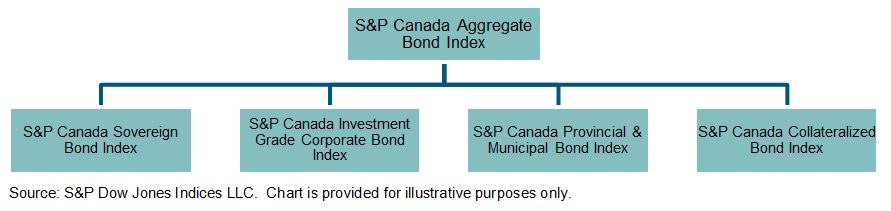
The S&P Canada Aggregate Bond Index has returned 1.11% for the month and 3.16% YTD as of June 13, 2016. This benchmark index is a market-cap-weighted aggregation of the individual components, of which sovereign bonds (federal bonds) have returned 2.47%, provincial & Municipal bonds have returned 3.68%, investment-grade corporate bonds have returned 3.04%, and collateralized bonds have returned 1.25%, as of June 13, 2016. The heavier-weighted sector of the overall index are provincials & municipals (47%) and sovereigns (29%).
Exhibit 2: Sector Weights
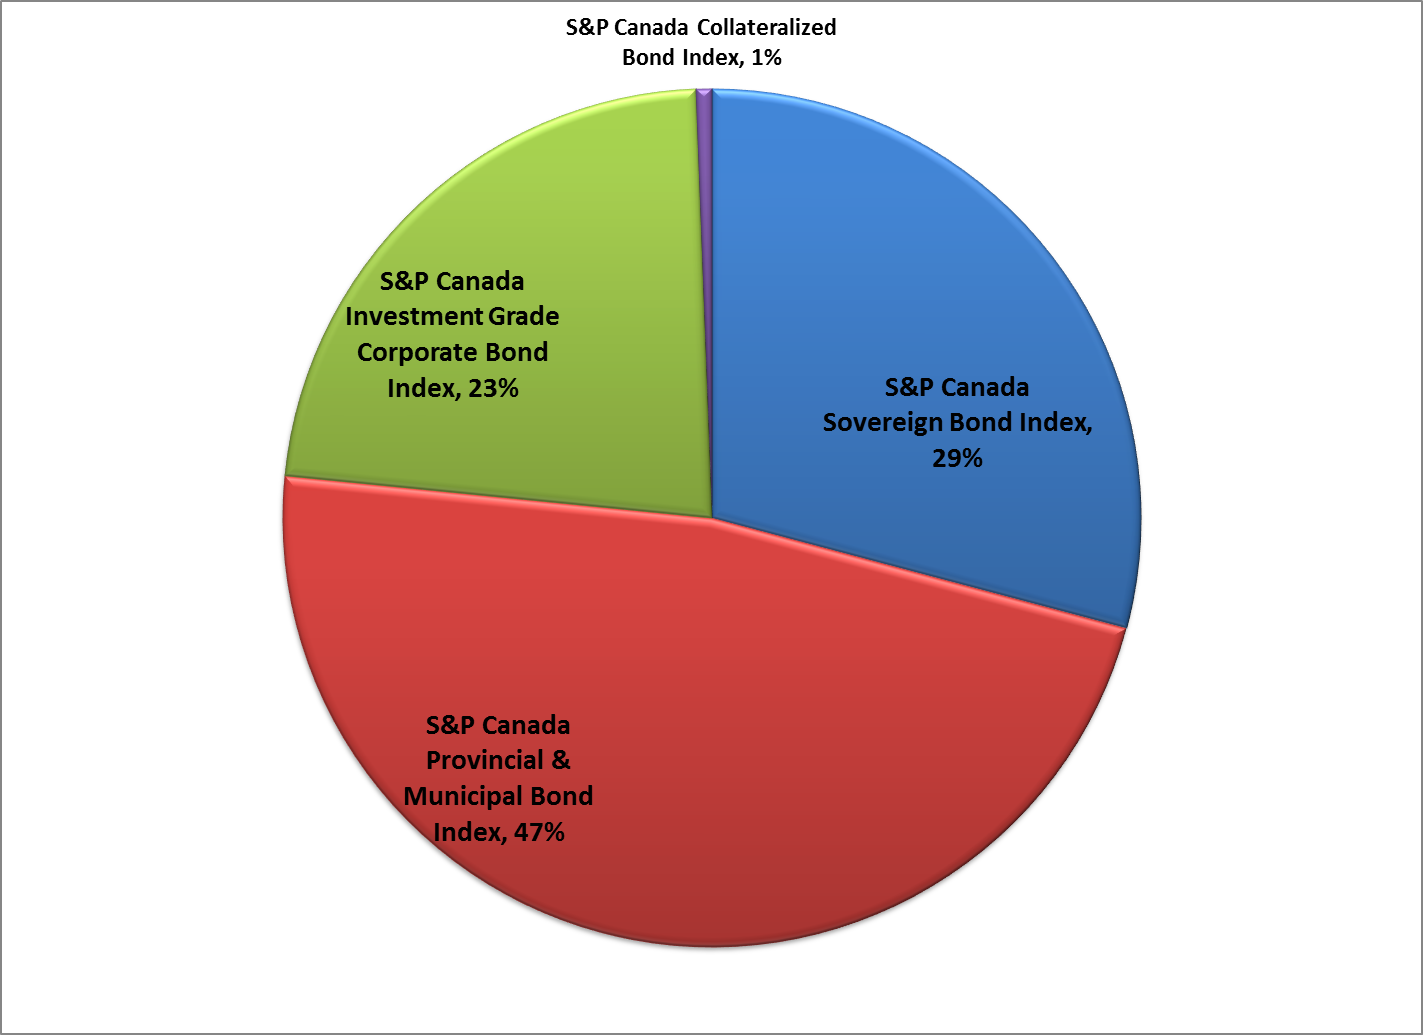 Source: S&P Dow Jones Indices LLC. Data as of June 13, 2016. Chart is provided for illustrative purposes.
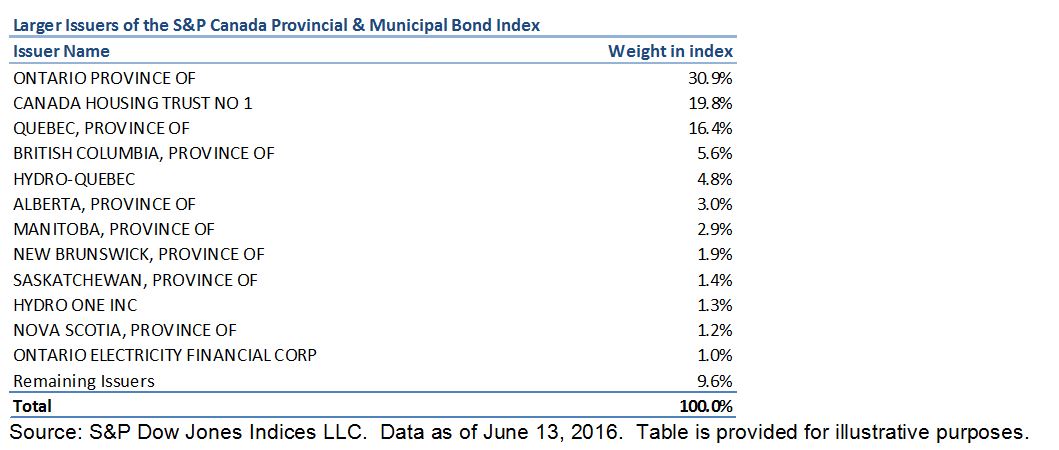
Diving deeper into the makeup of the index, the 47% weight held by provincials & municipals consists of issuers such as the ones displayed in Exhibit 3.
Exhibit 3: Issuers Within the S&P Canada Provincial & Municipal Bond Index
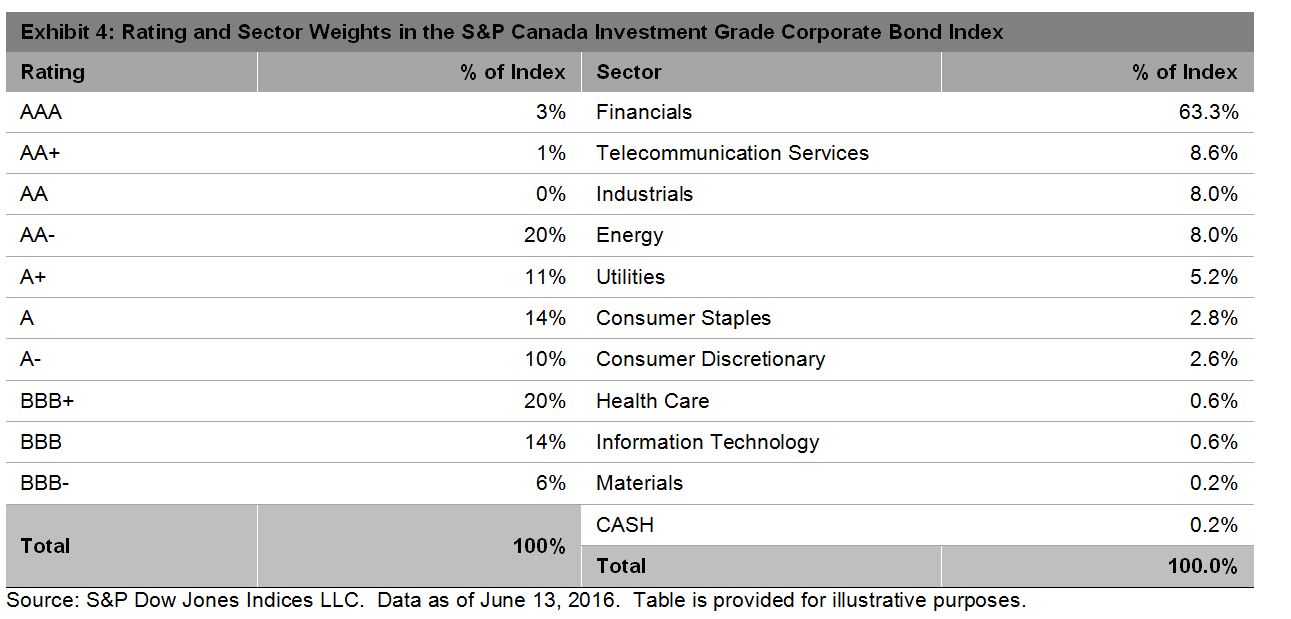
 The S&P Canada Investment Grade Corporate Bond Index contains 607 bonds and has a yield-to-worst of 2.2%. It is an investment-grade index, with 40% of its bonds residing in the ‘BBB’ rated category from a conservative ratings approach that takes the lowest of Standard & Poor’s Ratings Services, Moody’s, and Fitch. As a reflection of the Canadian market, the financials sector holds 63% weight in the index.
 The collateralized sector of the market accounts for a small percentage of the index, less than 1%. The S&P Canada Collateralized Bond Index contains 15 bonds with a market value of CAD 10 billion that meet the qualifications.