

Technicians frequently compare the performance of the S&P Consumer Discretionary sector with the Consumer Staples sector for guidance on the market’s “risk-on” or “risk-off” trend. When the more cyclical Consumer Discretionary sector, which contains such sub-industries as autos, homebuilding and retail, outperforms the more defensive Consumer Staples group, which includes food, beverage and tobacco firms, investors look upon that as a sign that the S&P 500 is entering into, or maintaining, an upward trend, and vice versa. History tells us, however, that the S&P High Beta (SPHB) and Low Volatility (SPLV) Indices offer a better market-timing mousetrap.
As the name implies, the S&P 500 High Beta Index measures the performance of 100 stocks within the S&P 500 that have the highest trailing 12-month standard deviations. On the other hand, the S&P 500 Low Volatility Index consists of the 100 stocks with the lowest volatility.
One of the drawbacks of monitoring the Consumer Discretionary/Consumer Staples (CD/CS) relative strength is that nearly 40% of the sub-industries in the Consumer Discretionary sector (and 44% of the cap-weighting) have betas that are equal to or lower than the market itself. A glaring example is Restaurants, which is dominated by the fast-food giant McDonalds, a company more frequently associated with defensiveness than cyclicality. This group, which represents 11.5% of the Consumer Discretionary sector, has a beta of 0.6. As a result, an investor seeking to compare apples with oranges through the CD/CS relative strength, actually ends up comparing something closer to oranges with tangerines.
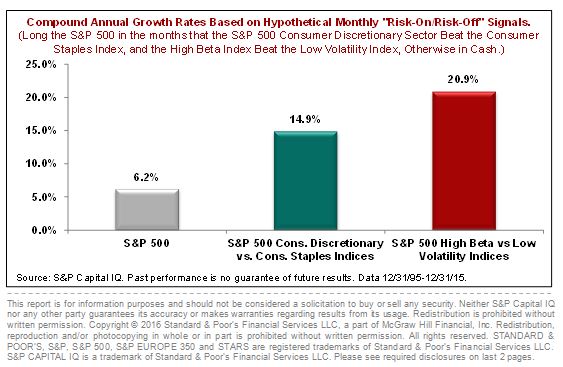
To see which indicator – CD versus CS or HB vs. LV – was better at offering “risk on/risk off” guidance, I looked at monthly price performances over the past 20 years, capturing the S&P 500’s price return whenever the cyclical index (CD or HB) beat the defensive index (CS or LV), but applying no change when the defensive index beat the cyclical one. Obviously, I had no way of knowing in advance if CD or HB would beat their respective defensive counterparts in the month ahead. I was merely interested in seeing which pair delivered superior results whenever their market timing signals were either “on” or “off.”
The S&P 500’s price-only compound annual growth rate (CAGR) from 12/31/95 through 12/31/15 was 6.2%. However, by owning the S&P 500 when CD beat CS, and then switching into cash when CS beat CD, the 20-year CAGR jumped to 14.9%. However, owning the S&P 500 when HB beat LV, and in cash during those months when LV beat HB, the CAGR soared to 20.9%.
So there you have it. There is now an alternative for those who chart the relative performance of the S&P 500 Consumer Discretionary sector against the S&P 500 Consumer Staples sector, but have been a bit disappointed with recent signals. A new and better mousetrap, in my opinion, is available by monitoring the relative strength of the S&P 500 High Beta and Low Volatility Indices. When HB is beating LV, its best to stay in stocks. Yet when LV outshines HB, it has usually been wise to take a powder. Of course there’s no guarantee that what worked in the past will work again in the future.
Register for S&P DJI’s complimentary live streamed event for financial advisors, “Where Can Smart Beta Take You?”
—————————————————————————————————–


 Source: S&P Dow Jones Indices LLC. Data as of Jan. 22, 2016. Past performance is no guarantee of future results. Table is provided for illustrative purposes.