Get Indexology® Blog updates via email.

In This List

The S&P 500's Flat Year

Most-Read Blog Posts Q4 2015

Dow Jones Industrial Average - 2015 Year in Review

The Rieger Report: 500 Index Sectors - Final 2015 Results

2015’s Rising Tide of ETFs in India

The S&P 500's Flat Year

Contributor Image
Craig Lazzara

Former Managing Director, Index Investment Strategy

S&P Dow Jones Indices

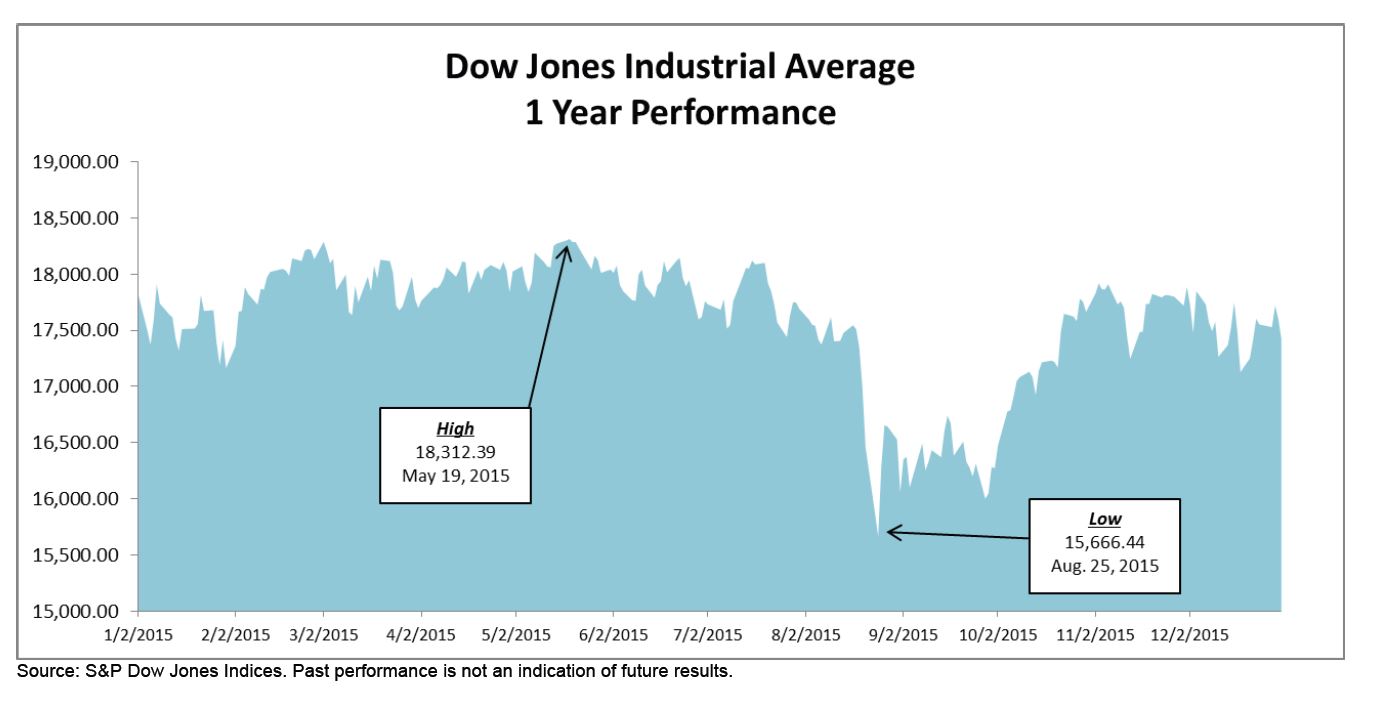
By now we are all painfully aware that the U.S. equity market was essentially flat in 2015.  The S&P 500’s total return was 1.38%, all of which was a function of dividend income — the index’s price return was -0.73%.  Other large-cap averages were in the same ballpark — the Dow Industrials, e.g., logged a total return of 0.21% — and smaller cap indices lagged slightly, as the S&P MidCap 400 and S&P SmallCap 600 both lost -2% on a total return basis.  Although there were peaks and valleys during the year, 2015 as a whole was notable for not being notable.

This is only true, of course, from a provincial American perspective.  What we often overlook is that in 2015, the strength of the U.S. dollar produced impressive results for investors from outside our borders:500 TR 2015 by currency

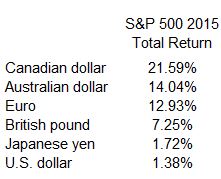
We’ve remarked on the importance of currency movements before.  There’s no alchemy involved here — as the U.S. dollar rose against the euro, e.g., European investors in the U.S. market benefited from being in the stronger currency.  And it’s worth noting that currency effects cut both ways.  Euro-based investors would have reaped a total return of 8.61% in the S&P Europe 350; U.S. investors in the same index lost -2.52%.

We profess no ability to forecast the course of either global equity markets or currencies.  What we can say is that if the U.S. dollar continues to strengthen, it will continue to benefit international investment into the U.S., as it did in 2015, and to penalize U.S. investment abroad.


The posts on this blog are opinions, not advice. Please read our Disclaimers.

Most-Read Blog Posts Q4 2015

Contributor Image
Paul Murdock

Manager, Content & Delivery

S&P Dow Jones Indices

In case you missed them, we’ve compiled the most read blogs from the fourth quarter below.

Losing My Religion: Value in the USA
How have value indices performed and will value investing “work” in the future?

The Rieger Report: Munis Lead the Pack in the Final Lap
How did the municipal bond market perform in 2015?

Energy Stocks and Bonds Say Oil May Have Bottomed
Has oil reached its bottom or is this just the market sentiment?

How Did European Active Managers Perform Over the Past 10 Years?
What were the results of the 2015 mid-year SPIVA® Europe Scorecard?

DJSI: A Journey Toward Sustainability and Beyond
How have the DJSI played a supporting role in leveraging sustainability as a key business driver for corporate success?

ETF Industry in India Over the Years
How has the ETF industry in India advanced over the years?

The posts on this blog are opinions, not advice. Please read our Disclaimers.

Dow Jones Industrial Average - 2015 Year in Review

Contributor Image
Jamie Farmer

Former Chief Commercial Officer

S&P Dow Jones Indices

The Dow Jones Industrial Average ended 2015 at 17,425.03 – down 398.04 points on the year for a -2.23% annual return.

  • Leader & Laggard – Nike (NKE) was the biggest contributor during 2015;
    Walmart (WMT) was the biggest detractor.
  • Industry Performance – Consumer Services was the leading industry for the
    year; technology the worst.
  • Worst Day (In Points & Percent) – down 588.40 points or -3.57% – on August
    24th. While bad – the worst 1 day loss since August 2011 – it could have been
    worse: the DJIA was down over 1,000 points in early trading before recovering.
  • Best Day (In Points & Percent) – a mere two days later, on August 26th, the DJIA
    finished up 619.07 points or 3.95% as investors were drawn back to the markets
    following a period of apparent panic selling.
  • New Highs – the second half of 2015 saw no new highs for the DJIA, the last
    having been struck on May 19, 2015 when the Average closed at 18,312.39.
  • Changes – there was a momentous component change when Apple replaced
    AT&T. Additionally, there were a few significant stock splits in 2015.

Capture

Download the full report

The posts on this blog are opinions, not advice. Please read our Disclaimers.

The Rieger Report: 500 Index Sectors - Final 2015 Results

Contributor Image
J.R. Rieger

Former Head of Fixed Income Indices

S&P Dow Jones Indices

The S&P 500 Bond Index sectors creates the opportunity to examine sector performance on both the stock and bonds issued by the companies in the S&P 500 Index.   The 2015 results: As expected corporate bonds were less volatile than their equity counterparts but they still suffered from the energy and materials onslaught.

Highlights (total returns used for comparability):

  • Of the ten sectors sampled, five equity sectors saw positive returns in 2015.
  • Bonds of the five sectors with negative performance did better than equities of those sectors.
  • Energy was the biggest mover with equities down over 21% and bonds of those same companies down over 8.6%.
  • Materials was also impacted hard in 2015 with equities down over 8.3% and bonds of those same companies down over 4.8%.

Chart 1: Selected S&P 500 sector indices for stocks and bonds

Blog Sectors 1 4 2015 Chart

Table 1: Selected S&P 500 sector indices for stocks and bonds

Blog Sectors 1 4 2015 Table

The posts on this blog are opinions, not advice. Please read our Disclaimers.

2015’s Rising Tide of ETFs in India

Contributor Image
Koel Ghosh

Former Head of South Asia

S&P Dow Jones Indices

In October 2015, the global ETF industry witnessed its all-time high of the year, with over 6,000 ETFs and ETPs and assets reaching the USD 3 trillion mark. The year also saw month-over-month increases in inflows to ETFs, with record increases in assets across regions.  Japan led in terms of year-to-date growth, with an increase of over 200%. However, in absolute terms, the leaders have been the usual: the U.S. and Europe. As per the latest numbers for the end of November, ETFs and ETPs have gathered over USD 300 billion in net new assets, which is a record in itself.

India has not been far behind in this year’s trend in ETFs. It indeed has been an interesting year for investors in India. Who would have imagined that India’s biggest pension fund would make a foray into equities, and using ETFs as the vehicle?  Was this a positive move? It definitely seems that way! The impetus provided to the segment was tremendous and the Indian ETF industry, which had assets merely trickling in and was struggling to stay afloat, suddenly surfaced into the limelight.

At the end of March, the Indian Ministry of Labour gave notice of a new investment regulation for the Employees’ Provident Fund Organization (EPFO), which allowed investments of up to 5% of incremental income in ETFs. There was added flexibility for exempt PF trusts for which equity investment limits would be higher, and they could invest anywhere between 5%-15% of their funds in equity and equity-related instruments.

It was indeed a historic moment, and for the first time in its 64-year history, the EPFO announced its first ETF investments, in the S&P BSE SENSEX ETF and the Nifty ETF, in August 2015. This move brought some much-needed confidence in ETFs, whose advantages can include diversification, transparency, liquidity, and cost effectiveness.

The Indian ETF industry currently has 52 products with approximately USD 2 billion in assets. It is interesting to note that in 2005, there were just six ETF products, with assets not even adding up to USD 1 billion.

Exhibit 1: Global Assets in ETFs or ETPs 

Exhibit 1 - ETF

If we observe the growth of ETFs in global markets, we would see that a growth trend started in 2008, in which the number of ETFs and ETPs nearly tripled, from just over 2,000 ETFs in 2008 to over 6000 ETF and ETPs in November 2015, with assets increasing from over USD 700 billion to nearly USD 3 trillion in the same time period. While the first trillion took over a decade, the subsequent increase in assets has only taken a couple more years, which suggests a rate of exponential growth.

India seems to be on the brink of that rise, and with the new changes, positive sentiments, and the boost being provided to ETFs; we might be looking at a similar trend for the Indian markets.

The posts on this blog are opinions, not advice. Please read our Disclaimers.