The concentration of bonds trading in the secondary market rises the weaker the credit quality of bonds.
The distressed segment of the junk bond market has the most concentrated trading activity indicating that the majority of bonds in that segment are significantly less liquid.
The top 20% of bonds in the S&P U.S. Distressed High Yield Corporate Bond Index in November represented:
- 86% of the total number of trades that occurred in that quality segment.
- 75% of the total market value of trades that occurred in that quality segment.
For comparison, trade data for other quality based indices is in the table below.
Table 1: Select Indices and Corresponding Trade Volume Statistics on the Bonds In Those Indices (Month of November 2015).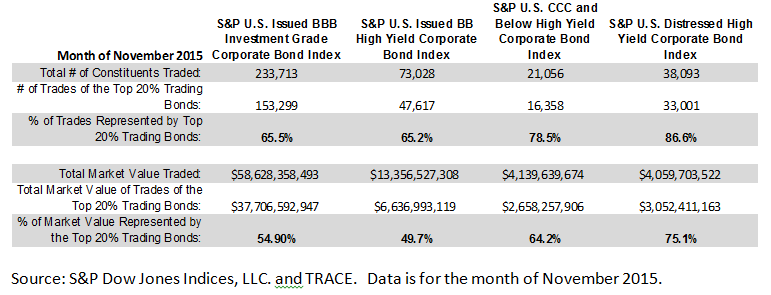
The posts on this blog are opinions, not advice. Please read our Disclaimers.