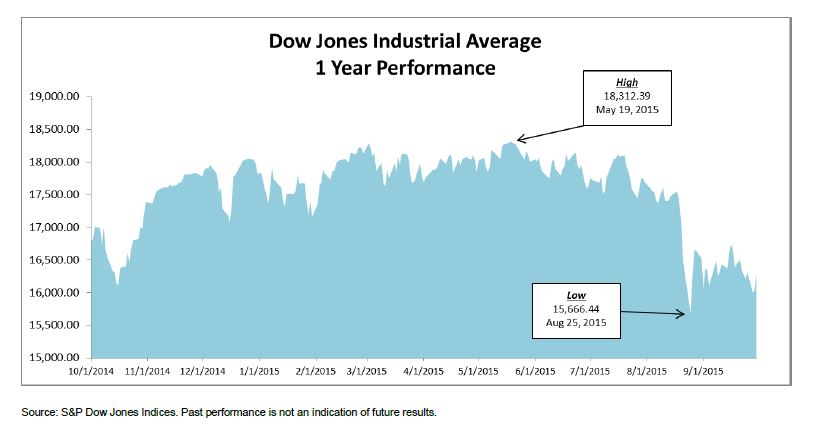
The Dow Jones Industrial Average ended September at 16,284.70 – down 1,538.37 points year to date for a -8.63% return. Q3 2015 was the worst calendar quarter since Q3 2011.
- Leader & Laggard – Nike (NKE) was the biggest contributor during Q3; Goldman Sachs (GS) was the biggest detractor.
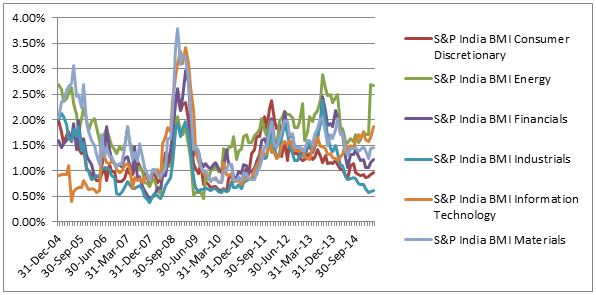
- Industry Performance – the Consumer Goods industry was the best (and, frankly, only) contributor during the period; Industrials the worst.
- Worst Day (In Points & Percent) – down 588.40 points or -3.57% – on August 24th. While bad – the worst 1 day loss since August 2011 – it could have been worse: the DJIA was down over 1,000 points in early trading before recovering.
- Best Day (In Points & Percent) – a mere two days later, on August 26th, the DJIA finished up 619.07 points or 3.95% as investors were drawn back to the markets following a period of panic selling.
- No New Highs – Q3 saw no new highs for the DJIA, the last having been struck on May 19, 2015.


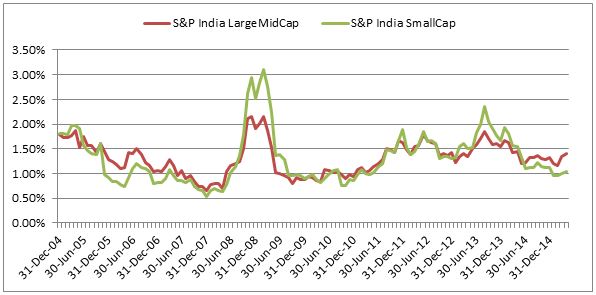
 Source: S&P Dow Jones Indices
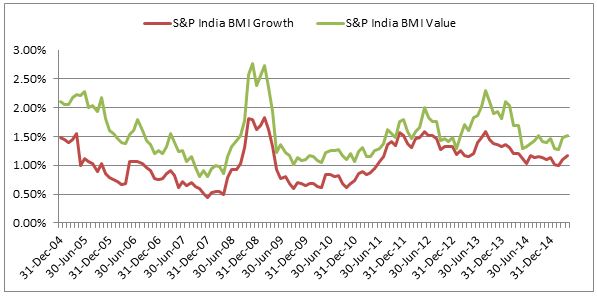
 Source: S&P Dow Jones Indices