MACRO-ECONOMIC OVERVIEW:
Over the last couple of decades (1994-2013), China noted an average GDP growth rate of 10%, while India noted an average GDP growth rate of a little less than 7% during the same period. However, over past few years, China has noted a steady decline in its growth rate. If the estimates of the International Monetary Fund (IMF) are to be believed, India is soon expected to become the fastest-growing large economy in the world.
Exhibit 1: GDP Growth Rate – IMF Database: Measured in Constant Prices (Local Currency)
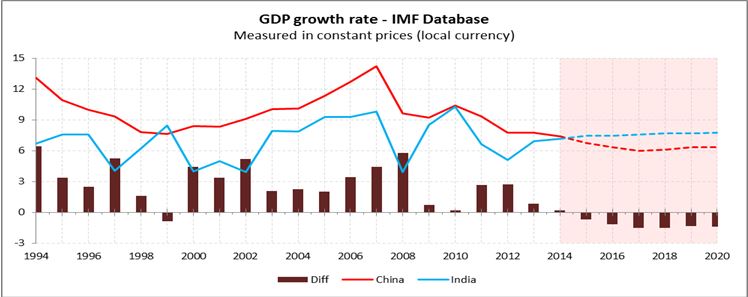
Source: IMF, World Economic Outlook Database, www.imf.org. Data as of April 2015. Chart is provided for illustrative purposes.
Historically, India’s growth has been primarily lead by a boom in the services sector, which contributed 47.4% to India’s GDP in 2013 (increasing from 41% in 1994). “Others”[1] was the second-largest contributor to India’s GDP, which contributed 36.7% to India’s GDP in 2013. Gains noted by the services sector was at the expense of the “others” category, which has noted declining GDP contribution numbers over past 20 years. Manufacturing has consistently been the smallest contributor to India’s GDP, ranging between 13%-17%; the sector’s contribution in 2013 was 15.9% of GDP.
China has also noted a similar level of contribution to its GDP by the services sector as India, as well as a similar steady decline of the “others” sector in its contribution to its GDP. However, unlike India, China has traditionally experienced a higher GDP contribution from the manufacturing sector. In order to spur its GDP growth rate, India may need to increase the contribution of the manufacturing sector to GDP.
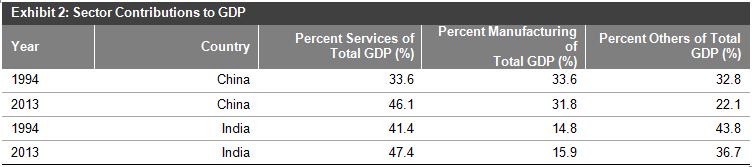
Source: World Bank, http://www.worldbank.org. Table is provided for illustrative purposes.
[1] “Others” is plug figure, and it includes anything other than services and manufacturing; it also includes agriculture and other small industries/sectors.
Exhibit 3: Sector Contributions to GDP by Country
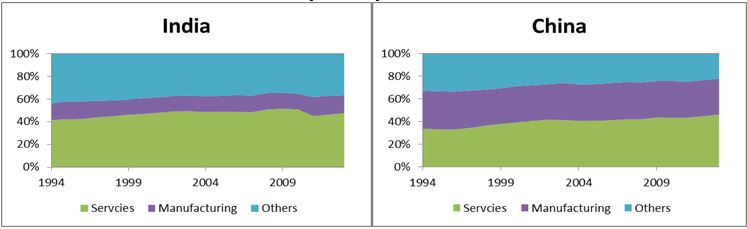
Source: World Bank, http://www.worldbank.org. Data as of year-end 2013. Charts are provided for illustrative purposes.
At present, India appears to be in a sweet spot of the economic cycle, with a recent fall in major commodities prices (including crude oil), resultant low inflation, reductions in the key interest rate by the Reserve Bank of India (RBI) (there has been a total reduction of 75 bps in interest rates). Also contributing to recent economic success in India are the government’s renewed efforts to boost the economy by way of economic reforms, a low current account deficit, and positive sentiments by global and domestic investors due to all of the aforementioned factors.
India also has a large pool of young hands with good skill sets. This, combined with low commodities prices (including crude oil), low inflation, and low interest rates, is conducive for the growth of the manufacturing sector. Manufacturing has great potential for direct and indirect job creation, and it may help to create a strong middle class population—a must for any strong economy. With the unveiling of the National Manufacturing policy in 2011, India has set an ambitious goal to increase the contribution of the manufacturing sector to 25% (from the level of less than 17% in 2011) in order to help create 100 million jobs by 2022.
S&P BSE INDIA MANUFACTURING INDEX:
The S&P BSE India Manufacturing Index is a first-of-its-kind equity index in India. The index is designed to measure the performance of the top 30 liquid and investable companies in production and manufacturing activities in the country.
The constituents are selected from the S&P BSE LargeMidCap, a sub-index of the S&P BSE AllCap. Issues eligible for inclusion are common stocks with a listing history of at least six months. Each stock must be issued by a company that is identified as part of the manufacturing and production BSE Industry Sub-Groups, which are listed in the index methodology. The index is calculated in real time.
The S&P BSE Manufacturing Index is diversified, with the maximum weight of a sector being capped at 30% and the maximum weight of an individual stock being capped at 10%. The index is reconstituted semi-annually, in March and September, and index values are available in Indian rupees and the U.S. dollar; the first value date of the index goes back to Sept. 16, 2005.
INDEX PERFORMANCE CHARTS AND TABLES:
Exhibit 4: Index Performance Since Inception:
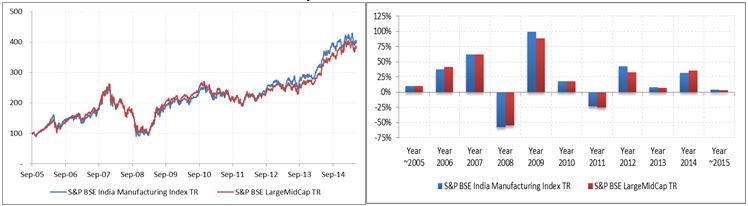
Source: Asia Index Private Limited. Returns used are total returns in INR. Data from September 2005 to May 2015. Symbol ‘~’ denotes partial caledar year returns. First value date of the S&P BSE India Manufacturing Index is Sept. 16, 2005. It is not possible to invest directly in an index. Past performance is no guarantee of future results. Charts are provided for illustrative purposes and reflect hypothetical historical performance.
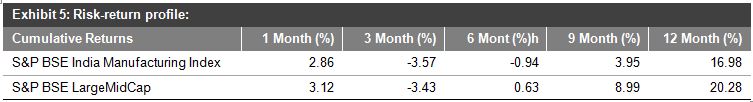
Source: Asia Index Private Limited. Returns used are total returns in INR. Data from September 2005 to May 2015. Symbol ‘~’ denotes partial caledar year returns. First value date of the S&P BSE India Manufacturing Index is Sept. 16, 2005. It is not possible to invest directly in an index. Past performance is no guarantee of future results. Table is provided for illustrative purposes and reflect hypothetical historical performance. Please see the Performance Disclosures at the end of this document for more information regarding the inherent limitations associated with back-tested performance.
Exhibit 6: Risk/Return Profile
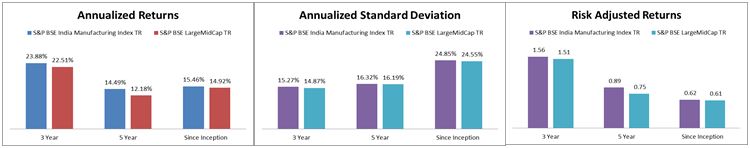
Source: Asia Index Private Limited. Returns used are total returns in INR. Data from September 2005 to May 2015. First value date of the S&P BSE India Manufacturing Index is Sep. 16, 2005. It is not possible to invest directly in an index. Past performance is no guarantee of future results. Charts are provided for illustrative purposes and reflect hypothetical historical performance. Please see the Performance Disclosures at the end of this document for more information regarding the inherent limitations associated with back-tested performance.
Exhibit 7: Sector Weights

Source: Asia Index Private Limited. Data as of May 29, 2015. Chart is provided for illustrative purposes.
HOW COULD THE S&P BSE INDIA MANUFACTURING INDEX HELP INVESTORS?
The S&P BSE India Manufacturing is a thematic index, and historically, the manufacturing theme has been cyclical in nature.
We have few tools that measure manufacturing activities in India, such as the Index of Industrial Production (IIP), the HSBC India Manufacturing PMI, or the SBI Composite Index; however, these tools don’t measure share price performances and are not investable. The S&P BSE India Manufacturing Index may complement all of these indices, as it is designed to measure the equity share price performance of companies generating revenue from manufacturing and production activities. The design of the index takes care of investability, and the index is likely suitable for low-cost investment products such as ETFs or index funds.
The posts on this blog are opinions, not advice. Please read our Disclaimers.