Get Indexology® Blog updates via email.

In This List

Mid-Year Commodity Checkup: Alive Despite The Flatline

Should You Make Chemical Enhancements To Your Portfolio?

Greece Is not out of the Picture for U.S. Investors

Greece: Will They Pay Or Will They Go Now?

The Rieger Report: Puerto Rico Bonds Face Plant

Mid-Year Commodity Checkup: Alive Despite The Flatline

Contributor Image
Jodie Gunzberg

Former Managing Director, Head of U.S. Equities

S&P Dow Jones Indices

On the surface, the most basic commodity beta, the S&P GSCI, hasn’t done much in 2015. It is down just 21 basis points (bps) for the year after losing 11 bps in June. Further, only 9 of 24 commodities are positive year-to-date with the overall term structure in contango after two years of structural backwardationCoffee, lean hogs and nickel are the biggest losers for the year, down 24.6%, 24.5% and 21.5%, respectively. However, unleaded gasoline, cocoa and cotton that are up the most of 20.3%, 12.4% and 10.7%, respectively, have gained significantly.

Please see the table below for sector performance through June 30, 2015:

Source: S&P Dow Jones Indices

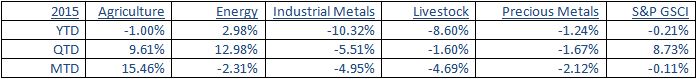
Most interesting in 2015 thus far is the volatility in commodities with 9 of 24 commodities posting double-digit moves for the year. The volatility in energy peaked in early April followed by an industrial metals spike in May. The performance of energy has been so dominated by oversupply that its response to the economy has been masked. However, industrial metals, also known for its economic sensitivity had spiked together with energy in April – that was indicative of a contraction, and these sectors followed with weak performance.  The volatility with the poor performance was finally enough to drive a new wave of investor selling that may be just the catalyst needed to stabilize the market. If open interest collapses, then production may slow as insurance in the futures market becomes too expensive. Historically in high volatility periods, open interest needs to collapse before oil finds stability again.

Source: S&P Dow Jones Indices

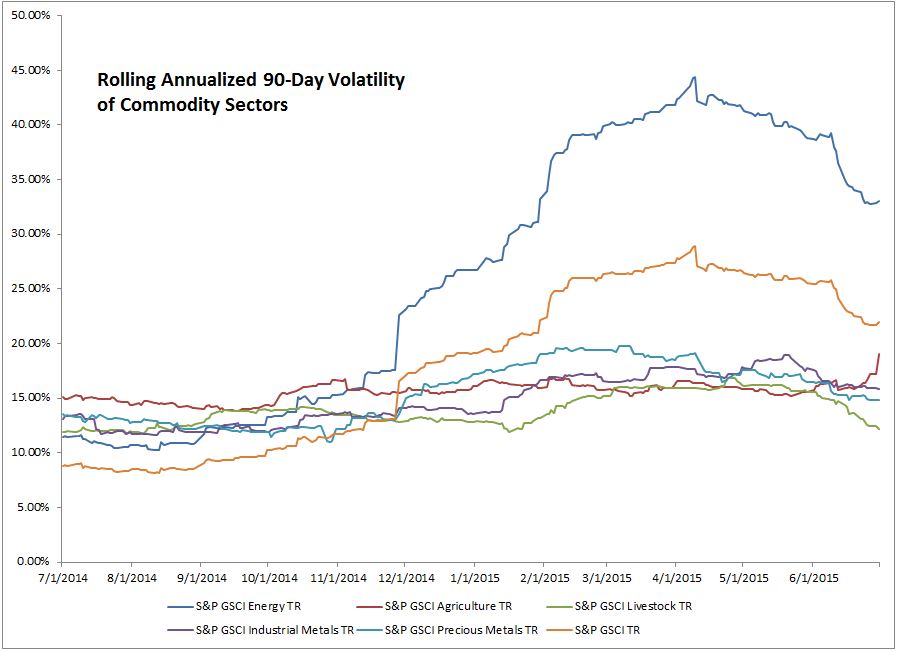
The one sector that is picking up volatility is agriculture. Extreme weather from El Nino may be the biggest driving force in the solid gains for every single one of the eight commodities in the sector in June. The grains were up 20.0% in June, its fourth best month in history (since July 1982) and best June since 1988. Even with lesser performance of only 3.1% in June, agriculture posted its biggest monthly gain in three years with its sixth best month in history.

Going into the summer there is generally an increase in demand for gasoline to support more driving; however, the bad news for consumers is that gas prices rise much quicker with oil prices than they fall when oil falls. Cheaper natural gas and livestock are other summertime favorites that may help consumers maintain demand for gasoline through the driving season. However, livestock is now showing seasonal shortages (is the only sector in backwardation) so the prices may start to rise – and at an accelerated pace from the increasing prices of grains used to feed the livestock.

The posts on this blog are opinions, not advice. Please read our Disclaimers.

Should You Make Chemical Enhancements To Your Portfolio?

Contributor Image
Todd Rosenbluth

Director of ETF and Mutual Fund Research

S&P Capital IQ Equity Research

Most diversified index-based materials products have significant exposure to the chemicals industry, though the weightings can be different. For example, chemicals comprised approximately 70% of the S&P 500 Materials Index as of late June. Meanwhile, the S&P 500 Equal Weight Materials index had a 54% weighting in chemicals, with more exposure in containers & packaging companies. As such we think investors need to understand what drives the industry.

S&P Capital IQ thinks cost saving efforts can spur the chemicals industry to higher earnings per share (EPS) growth levels in 2016, after expected growth of less than 10% in 2015. We see industry revenues growing slightly and at a slower pace over the next few years. Our profit and revenue growth forecasts are tied to the likelihood of a steadily improving US macroeconomic environment, mostly offset by a stronger US dollar, significantly lower oil prices, and slowing economic growth in China.

The chemicals industry is comprised of five sub-industries: specialty chemicals, diversified chemicals, fertilizer & agricultural chemicals, industrial gases, and commodity chemicals.

According to S&P Capital IQ equity analyst Christopher Muir, revenues of specialty chemicals companies are mostly influenced by volumes, while commodity chemicals companies face significant threats to revenue per share from changes in commodity prices for their products or raw materials. For fertilizer & agricultural chemicals companies, prices of the products will likely affect fertilizer revenue per share, while agricultural chemicals, including specialty seeds, are more-specialized products, which are driven by volumes. Industrial gas companies are likely to see a mix of volumes and prices driving revenues.

In the fourth quarter of 2014 and first quarter of 2015, a rise in the value of the dollar versus other currencies had a negative effect on revenue per share, but a fall in the dollar index would be a positive in the second half of 2015 and in 2016. Specialty chemicals companies and divisions spend money and time developing new products. In most cases, Muir noted these new products are highly specialized to suit the end user, and as a result are often sold at much higher margins than their less specialized counterparts are, helping operating margin.

S&P Capital IQ recently published an Industry Survey that reviews the drivers of the chemicals industry. This report along with S&P Capital IQ stock and ETF reports tied to materials sector can be found on MarketScope Advisor.

Please follow me @ToddSPCAPIQ to keep up with the latest ETF Trends


—————————————————————————————————–

S&P Capital IQ operates independently from S&P Dow Jones Indices.
The views and opinions of any contributor not an employee of S&P Dow Jones Indices are his/her own and do not necessarily represent the views or opinions of S&P Dow Jones Indices or any of its affiliates.  Information from third party contributors is presented as provided and has not been edited.  S&P Dow Jones Indices LLC and its affiliates make no representations or warranties of any kind, express or implied, regarding the completeness, accuracy, reliability, suitability or availability of such information, including any products and services described herein, for any purpose.


The posts on this blog are opinions, not advice. Please read our Disclaimers.

Greece Is not out of the Picture for U.S. Investors

Contributor Image
Kevin Horan

Former Director, Fixed Income Indices

S&P Dow Jones Indices

The yield-to-worst (YTW) on the U.S. 10-year Treasury bond, as measured by the S&P/BGCantor Current 10 Year U.S. Treasury Index, increased by 21 bps and ended 34 bps higher.  At 2.47%, it appeared the optimism over a Greek settlement was justified.  The index has returned -2.90% MTD and -1.94% YTD as of June 26, 2015.  The story changed over the weekend, as Prime Minister Alexis Tsipras surprised all by calling a referendum on whether to accept the European terms.  The eurozone finance ministers rejected Greece’s request for an extension in order to hold a referendum.  As a result, Greek banks have been closed and limiting withdrawals.  The YTW of the U.S. 10-year U.S. Treasury bond opened Monday, June 29, 2015, trading at 2.29% as a result of Greece’s news.

The week’s news affected the S&P U.S. Investment Grade Corporate Bond Index in a similar way, as the YTW rose 13 bps over the week and was 33 bps higher .  The index has returned -2.20% MTD and -1.13% YTD as of June 26, 2015.

High yield, as measured by the S&P U.S. High Yield Corporate Bond Index and the S&P/LSTA U.S. Leveraged Loan 100 Index, which represents speculative-grade senior secured bank loans, was less driven by Europe’s news.  These indices have returned -1.06% MTD and 3.70% YTD, and -0.61% MTD and 2.02% YTD, respectively, as of June 26 & 28, 2015.
YTW ad YTD Returns


The posts on this blog are opinions, not advice. Please read our Disclaimers.

Greece: Will They Pay Or Will They Go Now?

Contributor Image
Heather Mcardle

Director, Fixed Income Indices

S&P Dow Jones Indices

All eyes are on Greece today, as government leaders indicated they will not be making the much awaited €1.7 Billion payment to the IMF.  This comes after banks have been shut, strict capital controls have been set, and after Standard & Poor’s Ratings Services further downgraded Greek debt to CCC- , with a negative outlook.  S&P Ratings said there is a 50% chance Greece will exit the Eurozone.

Greek PM Tsipras has decided to let the people decide via a referendum vote on July 5th.   A “no” vote would indicate rejection of creditors’ latest proposal, likely causing Greece to be forced out of the Eurozone.  While many were thinking that a last minute resolution to this crisis would come through in the 11th hour, Greece’s brazen moves are loudly bursting that bubble of hope.

Some say a Greek exit out of the Eurozone would be significantly less impactful today than a few years ago, yet it’s an increasingly likely reality that, ultimately, no one wants to deal with.  As of Monday, European and US leaders, while acknowledging the lesser impact, are still urging a deal.  Whether or not creditors are willing to relax their demands is another question.  The markets are choosing to play it safe however, and reacting as expected, with the reduction of risk.

Greece’s government bond market took a massive hit on Monday with the S&P Greek Sovereign Bond Index yield widening 471 bps, going from 11.48% on Friday to close at 16.197% on Monday.  Despite Spain’s economy minister trying to reassure the markets that the fear of contagion into Spain is significantly less than three years ago, Spain’s government bond markets declined on Monday as well. The S&P Spain Sovereign Bond Index yield widened 20bps to close at 1.52%.  The S&P Italy Sovereign Bond Index and the S&P Portugal Sovereign Bond Index widened 23bps. Germany, viewed as a bond market safe haven, saw its bond market rally in contrast, with the S&P Germany Sovereign Bond Index tightening 8bps from Friday’s close.

Capture

The posts on this blog are opinions, not advice. Please read our Disclaimers.

The Rieger Report: Puerto Rico Bonds Face Plant

Contributor Image
J.R. Rieger

Former Head of Fixed Income Indices

S&P Dow Jones Indices

The municipal bond market reacted yesterday to the Governor of Puerto Rico’s statement about not being able to repay its obligations. Prices of bonds issued by the commonwealth and various authorities tumbled driving a one day drop of over 6% in the S&P Municipal Bond Puerto Rico Index.  That index now reflects a negative 9.12% month-to-date return and negative 8.64% return year-to-date.  The worst monthly performance of this index since 1998 was August 2013 when the index recorded a negative 9.92% return.

General obligation bonds issued by Puerto Rico tracked in the S&P Municipal Bond Puerto Rico General Obligation Index have returned a negative 11.97% for the month-to-date (a record monthly drop in this index).  Yesterday’s one day drop in return for this index was over 6.8%.  Year-to-date the index has recorded a negative 10.5% total return.

The S&P National AMT-Free Municipal Bond Index, an investment grade index which excludes Puerto Rico bond issues was up modestly yesterday in sync with the higher quality bond markets.

Puerto Rico municipal bonds are included in the S&P Municipal Bond High Yield Index and helped drag that index into negative territory yesterday as the index recorded a negative 2.99% month-to-date and negative 1.24% year-to-date return.

Select Municipal Bond Index Yields and Returns:

Source: S&P Dow Jones Indices LLC.  Data as of June 29, 2015.
Source: S&P Dow Jones Indices LLC. Data as of June 29, 2015.


The posts on this blog are opinions, not advice. Please read our Disclaimers.