It is well known that wedding seasons, especially in India, support gold prices, and although the tradition of gold embellishments is not as prevalent in the United States, wedding rings are a popular symbol of marriage. So, in light of the U.S. Supreme Court’s ruling on legalizing same-sex marriages in all states, how might this impact the gold market?
From a variety of polls summarized here, there is a range of self-reported same-sex preference in up to 5% of the U.S. population (but possibly greater.) Also in the U.S., there are a reported 59.63 million married couples. If we double that number to account for two wedding rings per couple and take 5% of that, we get a total estimate of 5,963,000 wedding rings for same-sex marriage ceremonies. Given the average wedding ring is roughly 3 pennyweight, the value per 14 karat ring (that is 58.33% gold) is $102.82, using $1,175.10 per troy oz. of gold. Check out different values using this calculator that calculates (price of gold /troy oz * percentage gold * pennyweights in troy oz.) This means that the total estimated gold that might be demanded is $613,088,078.14. That is more than $600 million of gold! Let’s put that into perspective…
According to The World Bank data, it is equivalent in U.S. dollars to more than 5% of the gold reserves in Finland, more than 10% of the value of gold reserves in Greece, more than 20% of gold reserves in Honduras, more than 30% of reserves in Nicaragua and almost 40% of reserves in Ireland. It ranks bigger than 31 countries that reported reserves in 2014.
Given the gold price has been stable since the historically big loss 2013, it will be interesting to see if this wedding season, from the U.S., can help gold shine. 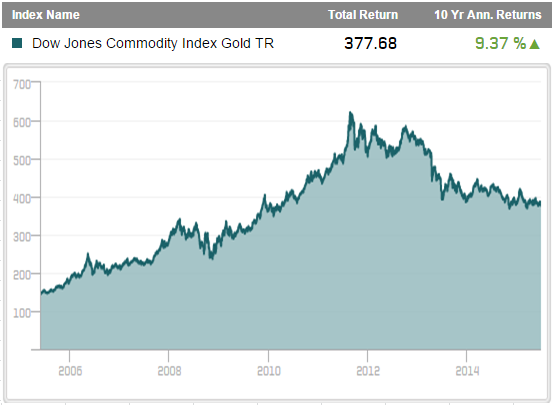
Source: S&P Dow Jones Indices
The posts on this blog are opinions, not advice. Please read our Disclaimers.