Get Indexology® Blog updates via email.

In This List

Risk On, Risk Adjusted: Retail and Institutional Money View Markets Differently

Looking Beyond This Week’s FOMC Meeting

A Curious Incident

Et tu, Robo?

Impact of the Affordable Care Act (ACA) on Total Business vs Total Business less Individual Market Trends

Risk On, Risk Adjusted: Retail and Institutional Money View Markets Differently

Contributor Image
Kevin Horan

Former Director, Fixed Income Indices

S&P Dow Jones Indices

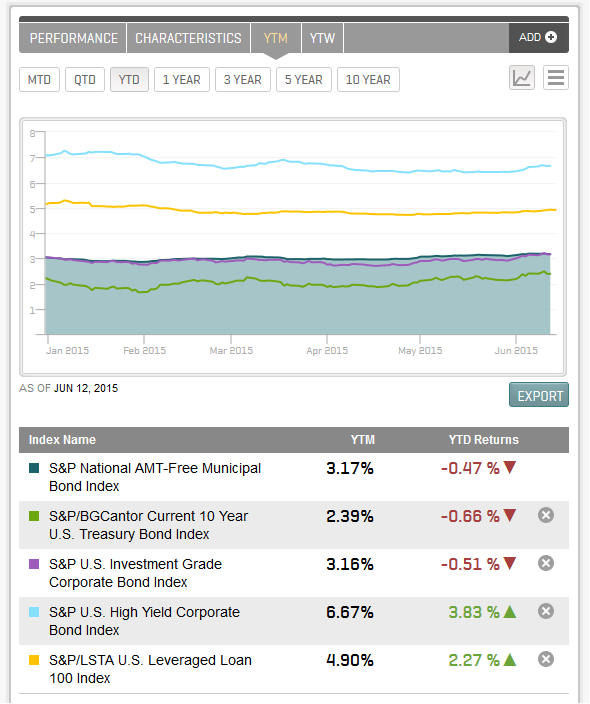
The yield-to-worst of the S&P U.S. Investment Grade Corporate Bond Index was relatively flat for the week, closing Friday, June 12, 2015, at a 3.15%.  For the previous week, Lipper data reported positive flows into investment-grade corporate bonds (June 3, 2015), which appeared to be buying on the dip, as the index moved from a yield of 2.89% on May 29, 2015, to the June 3, 2015, level of 3.10%.  The move into investment-grade corporate bonds may be opportunistic buying that resulted from the USD 2.6 billion of outflow in the high-yield market during the week of June 10, 2015.1 Current performance of the index is down, with the index having returned -1.60% month to date (MTD) and -0.51% year to date (YTD).

When comparing municipal bonds to investment-grade corporate bonds, the S&P National AMT-Free Municipal Bond Index has a yield-to-maturity of 3.17%, compared with the S&P U.S. Investment Grade Corporate Bond Index’s 3.16% pre-tax.  This traditionally retail-investor-heavy sector has a tax equivalent yield of 4.87%.  Coincidentally, the municipal bond index has only lost 0.47% both MTD and YTD.

According to the recent Financial Times article, “US junk bond rout entices asset managers”, market participants continue to require higher yields from speculative-grade investments in the face of outflows.  Professional investors tend to see the rise in yields as a potential buying opportunity for this sector.  The yield of the S&P U.S. High Yield Corporate Bond Index has moved from 6.11% at the beginning of the month to its current level of 6.46%.  The index has returned -0.94% MTD and 3.83% YTD.  Similar to high-yield bonds, speculative-grade senior loans, as measured by the S&P/LSTA U.S. Leveraged Loan 100 Index, have returned -0.36% MTD and 2.27% YTD.

Market participants’ attention will likely be on this week’s Federal Open Market Committee (FOMC) rate decision scheduled for Wednesday, June 17, 2015.  The current range of 0.00% to 0.25% is expected according to surveys.  Many investors are looking to September rather than this week’s meeting for any kind of decision.  The  week before saw the yield of the S&P/BGCantor Current 10 Year U.S. Treasury Index close two bps tighter at 2.39%, after a 27-basis-point widening the week before.  The index has lost 2.23% MTD and is down 0.66% YTD.  The S&P U.S. TIPS Index has not faired any better, as the index has returned -1.36% MTD and -0.40% YTD.  The May CPI level is due to be announced on Thursday, June 18, 2015, with 0.1% expected after having had levels of zero or slightly below since the start of the year.

1 Financial Times, US junk bond rout entices asset managers, June 15, 2015. (http://www.ft.com/intl/cms/s/0/f452f81e-129e-11e5-8cd7-00144feabdc0.html#axzz3d90M5lC9)
Fixed Income Yield Comparison

The posts on this blog are opinions, not advice. Please read our Disclaimers.

Looking Beyond This Week’s FOMC Meeting

Contributor Image
David Blitzer

Former Managing Director and Chairman of the Index Committee

S&P Dow Jones Indices

The Federal Reserve’s policy makers, the FOMC, meet today and tomorrow (Wednesday) to review the economy and monetary policy.  The minutes of the April meeting and recent comments by various FOMC members point to no change in interest rate policy at this meeting.   Recent economic news is upbeat and the debates over the weak first quarter GDP have been largely forgotten. Barring a combination of a renewed plunge in oil prices and sluggish economic reports, the Fed funds rate is likely to be 25 bp later this year, possibly as soon as September.

The first rate hike isn’t something to worry about. Developed country financial markets should react quickly and briefly and settle down within a day or two. The big question is how long the Fed waits before making another move to a 50 bp Fed Funds rate.  If a quick second step comes before the end of this year,  market participants will either think that the Fed sees a lot more inflation than anyone else or that it feels it is behind the curve and waited too long to act. Either way, markets are likely to push yields higher.

The prospects are different in emerging markets.  While the funds rate is a US benchmark and the Fed is the American central bank, both the rate and the Fed matter around the world. The reason the IMF argued recently that there is no reason to raise rates until 2016 was to delay reactions in emerging markets.  Many emerging economies took on new debt in the last few years. Many also depend on exports of oil or other commodities and are suffering with lower prices. This combination of higher debt and less income means that some emerging markets are likely to investors look for other opportunities as markets decline when the Fed moves.

The FOMC will issue a statement tomorrow at about 2 PM Eastern time. It will be carefully read for hints of when a move might come: September, October or December. Further signs of a strong economy with gains in housing and business investment as well as labor markets will point to September.

The posts on this blog are opinions, not advice. Please read our Disclaimers.

A Curious Incident

Contributor Image
Fei Mei Chan

Former Director, Core Product Management

S&P Dow Jones Indices

“Is there any point to which you would wish to draw my attention?”
“To the curious incident of the dog in the night-time.”
“The dog did nothing in the night-time.”
“That was the curious incident,” remarked Sherlock Holmes.
Arthur Conan Doyle, “Silver Blaze” (1892)

Sometimes, as Holmes appreciated, what is missing is as interesting as what is present — in investments as well as in criminology.  High concentration in less volatile sectors is a result of the rankings-based methodology of the S&P 500® Low Volatility Index.  The Utilities sector has had a prominent weight in the S&P 500 Low Volatility Index throughout most of its history since 1992; the current 2.7% allocation to Utilities is the lowest in the entire history of the index (Exhibit 1).  In contrast, Financials, which had dwindled to a negligible weight during the 2007-08 crisis, now has a higher weight than any other sector.

Capture

We build the S&P low volatility indices by measuring volatility at the stock level, without sector constraints.  That said, large positions in relatively less volatile sectors tend to account for most of the low volatility strategy’s overall risk reduction.  The reduction in the weight of the Utilities sector and the increase in the prominence of Financials suggests a fairly dramatic shift in the volatility of both sectors.

Exhibit 2 shows the volatility of each of the S&P 500’s ten sector indices over the past five years.  The volatility of the S&P 500 Utilities index is modestly higher now than its average.  But the key point is not so much that Utilities have become more volatile. It’s that sectors that were more volatile (such as, most notably, Financials) have converged to become much less so—and the rankings-based methodology of the S&P 500 Low Volatility Index will home in on the lowest volatility.

Capture

The posts on this blog are opinions, not advice. Please read our Disclaimers.

Et tu, Robo?

Contributor Image
Shaun Wurzbach

Managing Director, Head of Commercial Group (North America)

S&P Dow Jones Indices

Many US financial advisors must feel like they are “under the gun” as the President and parts of his administration call for a stronger fiduciary standard.  Simultaneously, I receive several emails per day on “robo-advisors” and how they spell doom for financial advice as we know it.  I find the second challenge to financial advisors much more interesting.   I’ll share my reasons for why I think that robo-advice may disrupt the business of some financial advisors.

Robo-advice is a form of financial advice that provides portfolio management online with no or minimal human intervention.  Robo recommendations are generally index-based products in an all-asset and global portfolio which is selected by algorithms based on client input and risk tolerances.  The consensus seems to be that robo-advisors aren’t serving high net worth clients.  This is where many articles I have read end and suggest that after all, advisors need not worry since robos don’t compete for the same clients.  So, no conflict, right?  The mass affluent client or professional millennial who is emerging affluent that a robo-advisor recruits today is below a financial advisor’s investable asset minimum.  But any wealth management firm with a strategic plan needs to realize that robo-advice is actively targeting its client of the future.  And if robos provide useful and inexpensive financial advice to that client for any meaningful period of time, then what incentive will that client have to switch over to “full service” wealth management at some future date?

How disruptive might this be to financial advisors as a whole?  That depends on how many of their future clients robos can pick off.  We have some insight now on how well robos are doing in targeting these future clients, and let’s just say that some of them are gathering assets like…a machine.  Two of the better-known robo-advisors are New York-based Betterment and California-based Wealthfront.  Since both these firms are registered with the SEC as RIAs, we can see details about their compounded annual growth rates:

Capture

Seen from the perspective of an RIA, these two robo-advisors are large in AUM, growing extremely fast, and they have accumulated their growth by targeting relatively small account clients.  Some articles make the point that these two robo-advisor firms are not yet profitable and sustain themselves on private equity money.  With the CAGRs they have proven in AUM and client acquisition, how much longer will this lack of profitability be factual?   And how disruptive will this be if in three years, if each of these firms is at $10 Billion dollars in AUM?  Not possible?  Vanguard Personal Advisor Services, which I consider to be a hybrid of robo and human advice is now at $17 Billion in AUM.

Another aspect of this disruption is that like RIA strategists, robo-advisors are power-users of indexing and ETFs.  In my next post I will look at what Betterment and Wealthfront reportedly hold and how I think that what they hold may inform core investing and asset allocation.

In the end, I believe that some human financial advisors will mitigate this disruption risk by either adopting a robo-advice capability themselves or by sharpening and effectively communicating how their value and service differs from robo-advice.  Those advisory firms which fail to adapt to what robo-advice means as a disruptor may find it much harder to compete or to be profitable in the years to come.

The posts on this blog are opinions, not advice. Please read our Disclaimers.

Impact of the Affordable Care Act (ACA) on Total Business vs Total Business less Individual Market Trends

Contributor Image
John Cookson

Principal, Consulting Actuary

Milliman

The chart below shows the history of the S&P Claims Based Indices trends for total business and also total business less individual.  Up until 2014 the total and the total less individual were generally within a half a percent or so on a three month moving average trend basis. However, with the advent of the ACA in 2014, as individual trends shot up significantly, the gap between total and total less individual increased to about 2% at this point. This does not appear to be just an increase in individual trends, it is accompanied by a significant simultaneous reduction in non-individual trends. Starting in 2014 we have been forecasting trends to begin upward movement as a result of the improved economic recovery, but we have not yet seen any evidence of this on the LG/ASO trends. However, if we look at the total trends in the Chart below we can see that the trends appear to have bottomed out near the beginning of 2013 and have had a consistent upward movement through the available time periods as of November 2014.

Capture

We expect that trends will continue their upward movement in total, but the impact on LG/ASO will vary depending upon the results of what happens to individual trends and small group trends in 2015.  If individual trends return to more normal levels in 2015 this will likely lead to an upward movement in LG/ASO trends relative to 2014.

THE REPORT IS PROVIDED “AS-IS” AND, TO THE MAXIMUM EXTENT PERMITTED BY APPLICABLE LAW, MILLIMAN DISCLAIMS ALL GUARANTEES AND WARRANTIES, WHETHER EXPRESS, IMPLIED OR STATUTORY, REGARDING THE REPORT, INCLUDING ANY WARRANTY OF FITNESS FOR A PARTICULAR PURPOSE, TITLE, MERCHANTABILITY, AND NON-INFRINGEMENT.

The posts on this blog are opinions, not advice. Please read our Disclaimers.