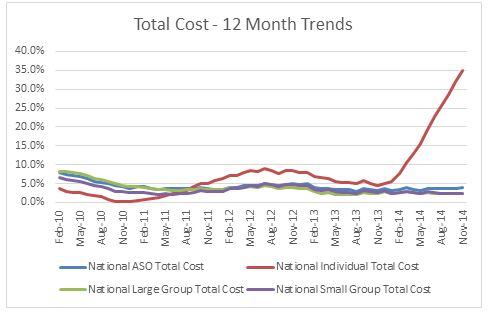
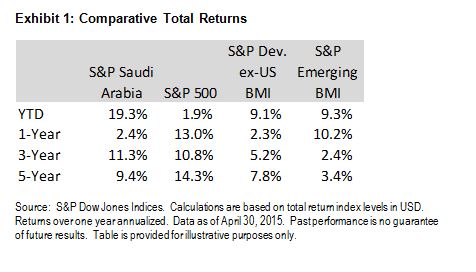
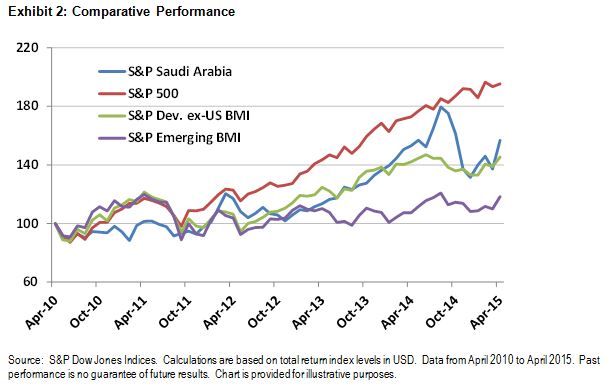
The importance of choice is gaining ground in all areas of life. I really resonated to the latest advertisement from Amazon, “Hindustani Dil Kahta Hai, Aur Dikhao, Aur Dikhao!” (“The Indian heart says, Show me more, show me more!”). I would agree that choice is not only important in our day-to-day lives; it also holds true while making investment decisions. A well-classified universe helps in avoiding confusion, as there are innumerable options to choose from and to use for setting goals or requirements. Good and clear categorization helps simplify the process.
Indian markets have witnessed quite a movement in the past year, with a one-year return of 21.31% for the S&P BSE SENSEX (one-year annualised price return as of May 8, 2015). When markets show such growth in a short time, analysts get busy trying to decode the trend and its attributes. It is then that it becomes essential to have a proper market gauge.
Exhibit 1: S&P BSE SENSEX Annual Returns
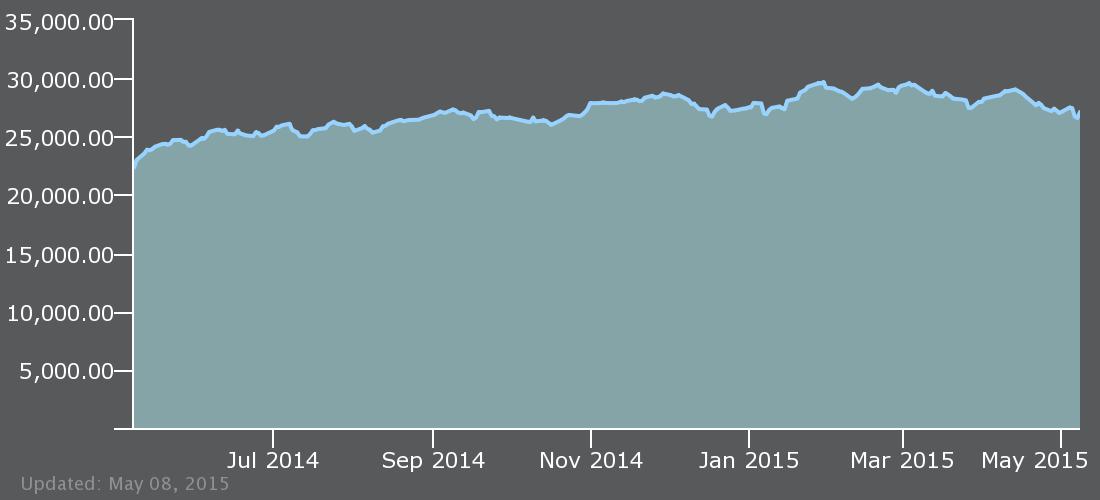
Source: S&P Dow Jones Indices LLC. Data as of May 8, 2015. Past performance is no guarantee of future results. Chart and table are provided for illustrative purposes only.
It is with this intent that last month, the S&P BSE suite of indices introduced the S&P BSE AllCap. This is a great tool for market research, as the subcategories that form this superset are clear and well-categorized segments that help provide distinct trends. Some may be aware that S&P Dow Jones Indices already had renowned and popularly tracked indices for the Indian market, such as the S&P BSE 100, S&P BSE 200, and S&P BSE 500, which serve as benchmarks for many investment strategies and funds. Why, then, did we create a new series?Source: S&P Dow Jones Indices LLC. Data as of May 8, 2015. Past performance is no guarantee of future results. Chart and table are provided for illustrative purposes only.
As an organization, assessing market requirements and taking active feedback from market players has been always an essential part of index creation. These two ingredients ensure that an index that is created is useful to a specific market and its participants. The new, S&P BSE Indices are aligned to global standards and practices that broaden the horizon of creating investment products. Globally, fund managers, investment professionals, and investors understand this classification as well.
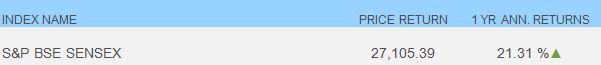
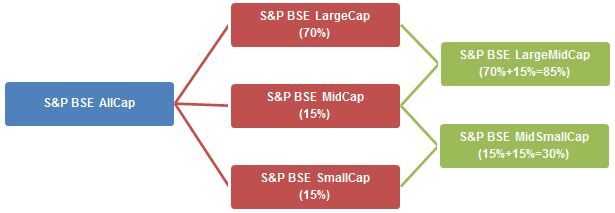
The S&P BSE AllCap is subcategorized into five size-based indices, with the primary indices being for large-cap, mid-cap, small-cap, large-mid-cap, and mid–small-cap companies. The index is further classified into 10 sector-based subindices.
The S&P BSE AllCap, with over 700 constituents, is a broad index covering more than 95% of total Indian market capitalization, and the index aims to be useful for broad market measurement or benchmarking. Hence, S&P Dow Jones Indices broadened the market coverage from the existing S&P BSE 500 to 700 stocks for the S&P BSE AllCap.
For those seeking to analyse market movements across size or sectors can track the five size-based indices and 10 sector indices.
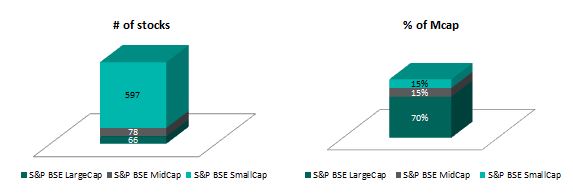
Exhibit 2: Size Subindices of the S&P BSE AllCap
Source: S&P Dow Jones Indices LLC. Chart is provided for illustrative purposes.
While we are using S&P Dow Jones Indices’ global methodology of 70%/15%/15% composition for the large-, mid-, and small-cap size-based indices, the sector indices conform to the BSE classification.
Exhibit 3: Sector Subindices of the S&P BSE AllCap
Source: S&P Dow Jones Indices LLC. Chart is provided for illustrative purposes.
These new indices are aimed at providing a tool for better analysis of market trends, as well as an accurate representation of the segments or sectors that make them ideal for new products.
Exhibit 4: Number of Stocks in the S&P BSE Size-Based Indices
Source: S&P Dow Jones Indices LLC. Data as of annual reconstitution in September 2014. Chart is provided for illustrative purposes.
Exhibit 5: Number of Stocks in the S&P BSE Sector-Based Indices
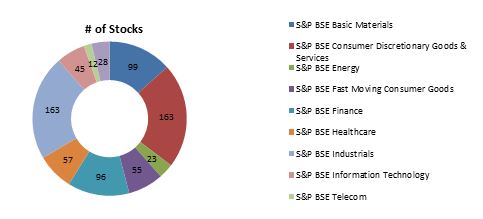
Source: S&P Dow Jones Indices LLC. Data as of annual reconstitution in September 2014. Chart is provided for illustrative purposes.
For more information on these new indices, you can log on to www.asiaindex.co.in.
The posts on this blog are opinions, not advice. Please read our Disclaimers.