The overall medical trend rates covering all services have continued to be modest in the S&P data through the 3rd quarter of 2014—increasing up to 3.5% on a 12-month moving average basis as of September[1].
But the winter of 2014 was particularly harsh in much of the country and likely dampened utilization. Late fall 2014 weather was cold and snowy, and recent weather in early February 2015 has become more severe. If the severe weather reaches the equivalent level of 2014, there will likely be minimal impact on trends, since the effect in two successive years is likely to balance out, although regional impacts can vary with the weather differences by region between the two years.
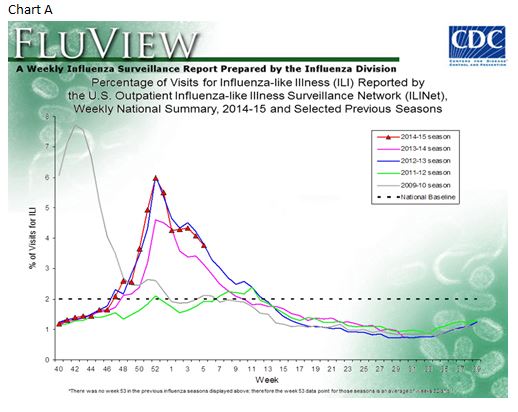
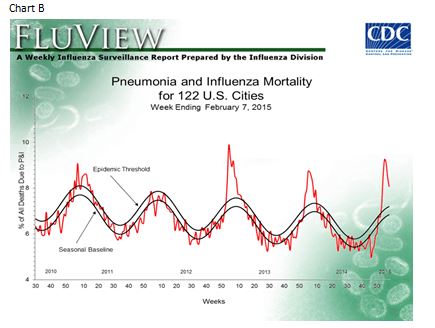
Influenza results for the 2014-2015 season appear to be similar but possibly slightly less than the 2012-2013 season and higher than the 2013-2014 season based on several measures. During the 2012-2013 season overall trends remained in the low single digits. Charts A and B below show several years of history for outpatient flu visits (Chart A) and pneumonia and influenza mortality (Chart B) from the Centers for Disease Control and Prevention.
[1] We track the LG/ASO trends as representative of underlying trends, since Individual and Small Group are impacted more significantly by the Affordable Care Act (ACA). Keep in mind that actual trends experienced by plans are likely to be higher than as reported in S&P data. Trends experienced by large employers on plans that have not changed in the previous year could be higher by as much as 2% or more on bronze level plans and higher by 1% or more on gold level plans due to the effects of deductible and copay leverage. So risk takers need to take this into account. In addition, the S&P Indices do not reflect the impact of benefit buy-downs by employers (i.e., higher deductibles, etc.), since the indices are based on full allowed charges. As noted above, actual trends experienced by employers and insurers in the absence of benefit buy-downs can be expected to be higher than reported S&P trends due to plan design issues such as deductibles, copays, out-of-pocket maximums, etc. Benefit buy-downs do not represent trend changes since they are benefit reductions in exchange for premium concessions, but they can have a dampening effect on utilization due to higher member copayments, and this can have a dampening effect on measured S&P trends compared to plans with no benefit changes, further pushing up experienced trends relative to those reported in the indices.
THE REPORT IS PROVIDED “AS-IS” AND, TO THE MAXIMUM EXTENT PERMITTED BY APPLICABLE LAW, MILLIMAN DISCLAIMS ALL GUARANTEES AND WARRANTIES, WHETHER EXPRESS, IMPLIED OR STATUTORY, REGARDING THE REPORT, INCLUDING ANY WARRANTY OF FITNESS FOR A PARTICULAR PURPOSE, TITLE, MERCHANTABILITY, AND NON-INFRINGEMENT.
The posts on this blog are opinions, not advice. Please read our Disclaimers.