Get Indexology® Blog updates via email.

In This List

Asia Fixed Income: China Onshore vs. Offshore

Freezing Temperatures, Hot Bonds

No Alchemy Needed

Home Price Bricks in Your Portfolio

Leverage Loan Redemptions = Record Trading Volume + Market Depth?

Asia Fixed Income: China Onshore vs. Offshore

Contributor Image
Michele Leung

Former Director, Fixed Income Indices

S&P Dow Jones Indices

The China offshore renminbi (CNH) bond market has been serving some investors as a gateway to Chinese bonds until the Renminbi Qualified Foreign Institutional Investor (RQFII) program takes off.  The size of offshore renminbi market is approaching CNH 800 billion, yet it is relatively small when compared with the CNY 27 trillion onshore bond market, which is tracked by the S&P China Bond Index.

Fundamentally speaking, the CNH and CNY currencies are different; additionally, onshore and offshore Chinese bonds are subject to different interest rate systems.  While the spreads of the yield curves have converged over time, some spread differences continue—e.g., 3 bps for a 5-Year Chinese government bond and higher for shorter-maturity bonds.

While China’s onshore market is vast, it is predominately restricted to domestic issuers.  On the other hand, many international issuers have tapped into China’s offshore market.  For example, there are quasi names such as the IFC, KFW, and Asian Development Bank, and corporate names like Volkswagen, Total, and Caterpillar.

Perhaps a more significant distinction is that 53% of Chinese offshore corporate bonds (by par amount) are rated by international rating agencies, according to the S&P/DB ORBIT Credit Index.  Of these, a total of CNY 61 trillion in bonds are rated as investment grade by at least one international rating agency (see Exhibit 1 for the index’s rating profile).  Of note, most of China’s onshore bonds are not rated by the international rating agencies.

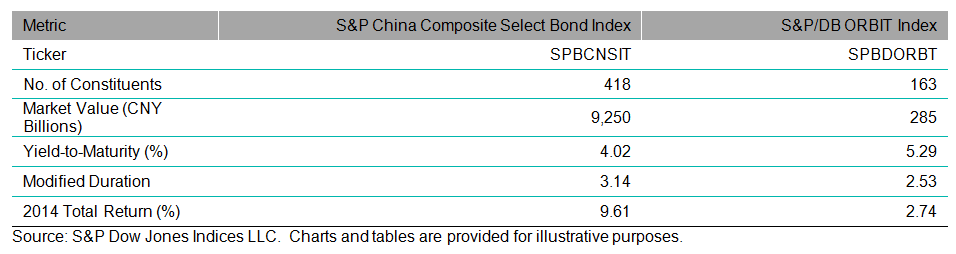
In terms of total return, the onshore market, tracked by the S&P China Composite Select Bond Index, rose 9.61% in 2014, outperforming the offshore market as represented by the S&P/DB ORBIT Index. Exhibit 2 shows a quick comparison of these two indices of investable bonds.  Last but not least, liquidity and accessibility are definitely the two key criteria to consider when differentiating China’s onshore and offshore bond markets.

Exhibit 1: The Rating Profile of the S&P/DB ORBIT Credit Index

Source: S&P Dow Jones Indices LLC. Data as of Feb. 2, 2015. Charts are provided for illustrative purposes. Calculation is based on the historical monthly returns from December 2009.

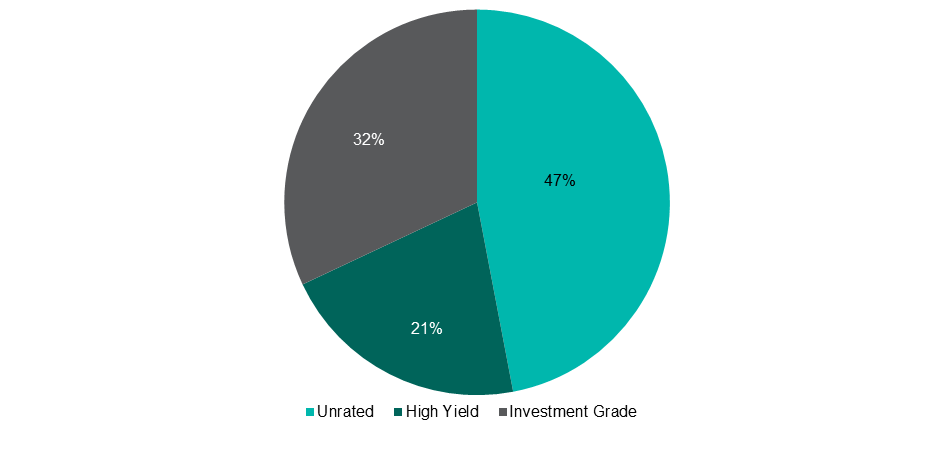
Exhibit 2: Comparison of Indices

Source: S&P Dow Jones Indices LLC. Charts and tables are provided for illustrative purposes.

Please click for more information on the S&P China Composite Select Bond Index and the S&P/DB ORBIT Index.


The posts on this blog are opinions, not advice. Please read our Disclaimers.

Freezing Temperatures, Hot Bonds

Contributor Image
Kevin Horan

Former Director, Fixed Income Indices

S&P Dow Jones Indices

The current cold snap that has descended upon the east coast of the U.S. has winter temperatures on par with its neighboring country to the north.  In addition to the weather, the Canadian bond market has seen its share of interest, as on Jan. 21, 2015, the Bank of Canada (BOC) cut rates by 25 bps to an overnight lending level of 0.75%.  The need for the BOC to act was created by sliding inflation, weaker crude prices (which threaten domestic sand oil production), and lagging employment growth.

After the news, Canadian sovereign bonds, as measured by the S&P Canada Sovereign Bond Index, rallied by 0.45%, and this continued into Jan. 23, 2015, with a 0.30% daily total return.  The index closed the month of January at 3.77%, and it has returned 3.86% YTD as of Feb. 2, 2015.  In comparison, the  S&P/BGCantor US Treasury Bond Index has returned 2.00% YTD as of Feb. 2, 2015.

Along with sovereigns, performance of additional segments of the Canadian fixed income market has been just as impressive.  Exhibit 1 shows that over the course of the last year, investment-grade corporates (as measured by the S&P Canada Investment Grade Corporate Bond Index) have tracked sovereigns tightly and recently began to underperform sovereigns.  As of Feb. 2, 2015, the S&P Canada Investment Grade Corporate Bond Index has returned 3.01% YTD.  Since the beginning of the year, the performance for all components of the S&P Canada Aggregate Bond Index has been strong.  The leader of the pack (including sovereigns, provincials and municipals, corporates, and collateralized bonds) has been the S&P Canada Provincial & Municipal Bond Index.  After returning 10.48% in 2014, this segment of the Canadian market has returned 5.83% YTD (as of Feb. 2, 2015).  The combination of yield and a government guarantee has led to significant 2015 performance for securities in this index, with issuers such as Canada Mortgage and Housing, the Province of Quebec, Saskatchewan, British Columbia, and Ontario being some of the top performers.

The laggard of the group is the S&P Canada Collateralized Bond Index, which has returned 1.54% YTD as of Feb. 2, 2015, but the index represents less than 1% of the S&P Canada Aggregate Bond Index.

Exhibit 1: Total Returns of Canadian Bond Indices
Total Returns of Canadian Bond Indices

Source: S&P Dow Jones Indices LLC.  Data as of Feb. 2, 2015.  Charts and tables are provided for illustrative purposes.  Past performance is no guarantee of future results.

The posts on this blog are opinions, not advice. Please read our Disclaimers.

No Alchemy Needed

Contributor Image
Craig Lazzara

Former Managing Director, Index Investment Strategy

S&P Dow Jones Indices

In January 2015, the total return of the S&P 500 Index was -3.0%.  We published this number last Friday evening, after January trading ended, and of course it’s been widely reported since then.  It may therefore surprise you to learn that some investors in the S&P 500 reaped a total return of +4.0% in January.

In this case, there’s no magic needed to turn dross into gold; all the work is done by currency translation.  European investors in the U.S. may have suffered the index’s -3.0% decline, but by holding assets in U.S. dollars rather than in Euros, they avoided the Euro’s -7.0% fall against the dollar.  Translated back to their home currency, they therefore made 4.0% in January.  Similarly, European investors in the S&P TOPIX 150 earned a total return of 9.8% — perhaps surprising their Japanese counterparts, who thought their local market was up by barely 0.2%.  The same effect applies to any pair of relatively strong and relatively weak currencies.  (Last month Canadian investors earned 0.6% in the S&P TSX 60.  Americans who ventured north lost -8.1% as the greenback gained against the loonie.)

Other things equal, if the Euro continues to weaken relative to the dollar, European investors will be more attracted to U.S. investments than they would be otherwise, and similarly U.S. investors will have an incentive not to direct funds to Europe.  Some have therefore argued that “the strong dollar will act like a magnet for global capital.”

Continued currency movements could have that effect.  It’s important to remember, though, that to make this alchemy work, it’s not enough that the dollar be strong.  The dollar must strengthen; changes in exchange rates (and other financial variables) are far more important than the level of those variables.  That said, if the dollar continues to rise, American investors’ home bias will continue to be rewarded, and the U.S. will look increasingly attractive to their European and Canadian counterparts.

The posts on this blog are opinions, not advice. Please read our Disclaimers.

Home Price Bricks in Your Portfolio

Contributor Image
Marya Alsati

Former Product Manager, Commodities, Home Prices, and Real Assets

S&P Dow Jones Indices

In this post, we look at whether adding a home price index, as part of a multi-asset bundle, to a hypothetical portfolio could potentially improve its attributes. We created two portfolios, one comprised of equities and bonds (portfolio A), and a second that contained the elements of portfolio A plus commodities, home prices and infrastructure (portfolio B). We found that the undiversified portfolio A performed better, while the diversified portfolio B had a lower risk attribute during shorter time periods. The two portfolios converged over the long run.

Exhibit 1 shows the weight distribution of the indices in each hypothetical portfolio.

Diversification_Exhibit1

In the short run, the performance of portfolio A outperformed portfolio B. In fact, during the 12-year period, on a monthly basis, portfolio A outperformed portfolio B 56% of the time. Interestingly, the two portfolios had similar maximum gains and declines, and they also showed similar average returns, as shown in Exhibit 2.

Diversification_Exhibit2

It can be seen from Exhibit 3 that in the long run, the two portfolios converged in terms of risk and returns. However, in the short run, higher returns could be obtained using the undiversified portfolio and lower risk in the diversified portfolio. Note that these results would vary if the weighting scheme and indices used change.

Diversification_Exhibit3

The posts on this blog are opinions, not advice. Please read our Disclaimers.

Leverage Loan Redemptions = Record Trading Volume + Market Depth?

Contributor Image
Tyler Cling

Senior Manager, Fixed Income Indices

S&P Dow Jones Indices

With the majority of the fixed income world taking sides on prize fights like Greece, the European Central Bank (ECB), inflation, and energy-related debt, you may have missed the beating leveraged loans have been receiving in the media.

The Financial Industry Regulatory Authority (FINRA) cited senior loan liquidity concerns in their January letter, stating “…these loans could face liquidity challenges if a significant number of investors make redemption requests at the same time.” Forbes published an article last week observing outflows in the bank loan market 39 of the last 40 weeks, totaling USD 25.9 billion in redemptions from the asset class. How did loans fair in the redemption ring?

Leverage_Loan_Redemptions_Figure1

The Loan Syndications & Trading Association (LSTA) saw bank loan trading volumes increase 21.5% in 2014, to a record $628 billion, from the previous year (Exhibit 1). The LSTA also observed record market depth in the fourth quarter of 2014. In Q4 2014, over 54% of the 1,750 loan facilities traded, traded 20 times or more (see Exhibit 2).

Leverage_Loan_Redemptions_Figure2

While we all know past performance is not indicative of future performance, in times of record redemptions, why is the dialogue focused on liquidity concerns versus liquidity metrics? It is also worth noting that during the final nine months of 2014, bank loan mutual funds were able to meet over USD 28 billion redemption requests in every single case.

The S&P/LSTA Leveraged Loan 100 Index, which seeks to track the largest loan facilities, has been less volatile than the S&P U.S. Issued High Yield Corporate Bond Index over the past five years and it has achieved comparable risk-adjusted returns. Yields are also higher for the S&P U.S. Issued High Yield Corporate Bond Index than for the S&P/LSTA Leveraged Loan 100 Index (6.5% versus 5.05%, respectively), implying that market participants are willing to hold bank loans for less of an interest return than high-yield corporate debt.

Leverage_Loan_Redemptions_Figure3

With all credit, liquidity concerns for bank loans are real, but they should be viewed relative to the fixed income marketplace. The leverage loan bout might just be back-page news because it is lacking the glass jaw worthy of the K.O. headlines monopolizing page one.

Leverage_Loan_Redemptions_Figure4

The posts on this blog are opinions, not advice. Please read our Disclaimers.