Get Indexology® Blog updates via email.

In This List

Despite sub-6% Unemployment, Economic Growth is Mixed and Investors are Challenged

Brent Ousts WTI From Top Spot

Green Bonds, Green Projects, Green Indices and…a Greener World?

First, catch a rabbit

Risk Managing With ETF Portfolios

Despite sub-6% Unemployment, Economic Growth is Mixed and Investors are Challenged

Contributor Image
David Blitzer

Former Managing Director and Chairman of the Index Committee

S&P Dow Jones Indices

This morning’s report on September Employment beat expectations and took the unemployment rate to 5.9%, the lowest in six years.  Payrolls gained 248,000 jobs and the labor force rose by 317,000 people.  The stock market responded with a better than 10 point jump in the S&P 500 at the open as the Dow added about 175 points in the first 45 minutes of trading.

As nice as the news is, the longer run prospects for the economy are mixed. Sustaining the 4%-plus GDP growth seen in the second quarter will be difficult.  One way to project GDP growth is to look at the growth in the labor force and productivity.  This analysis won’t catch quarter to quarter shifts or reflect each adjustment by the Fed; it will show the intermediate term prospects for the economy based on the supply side and potential GDP.  In simple terms, GDP’s potential depends on how many people are working and how much they produce.  If the number of workers grows by half a percent annually and productivity (output per person) at one percent per year, GDP potential growth is the sum: one-and-one-half percent.  While the economy can grow faster when it is recovering from a slump, as it did in the second quarter, it can’t sustain a pace above the potential growth over the long run.

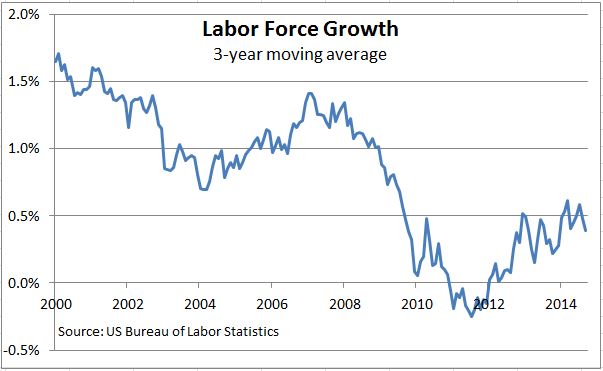
Currently the labor and productivity numbers aren’t encouraging.  Labor force growth in the three years ended in September was 0.4% annually.   The first chart shows the figures (three year moving averages) since 2000.  With population growth at 0.9% and the population aging, labor force growth isn’t likely to get much above 0.5% — and that’s assuming that the unemployment rate stays under 6% and some discouraged workers return to the job market.

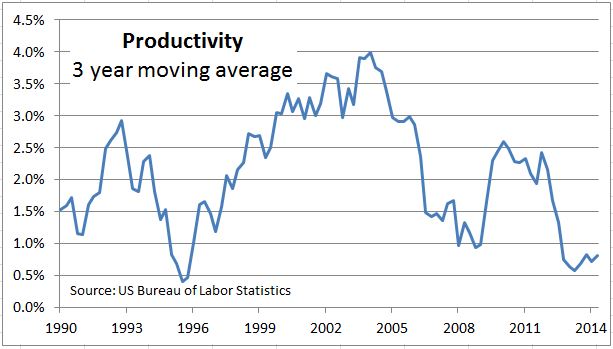
Productivity growth isn’t encouraging either. In the three years through the 2014 second quarter it grew 0.8%. The second chart shows this series since 1990. Productivity was strong during the tech boom in the 1990s, fell from its 2004 peak at 4% and enjoyed a short rebound in 2010-2011.  An optimistic guess from the future is 1.5% or possibly 2%. Combine that with labor force growth and the US economy long run growth might be a bit better than 2%.

Two percent growth with interruptions for geopolitical crises, Fed tightening and other surprises is a challenge for investors.  In a low to moderate growth environment, inflation, interest rates, dividend yields and other returns will remain low. Equity markets and corporate profits may benefit from smaller cost increases, but a strong rebound wages and incomes will be difficult.  The boost in asset prices engineered by the Fed with low interest and discount rates is largely behind us. One challenge to investors will be to keep the expenses and costs of investments as low as possible so they take home as much of smaller returns they earn as they can. No wonder we are seeing reports about the strong growth of index-based investment approaches.

The posts on this blog are opinions, not advice. Please read our Disclaimers.

Brent Ousts WTI From Top Spot

Contributor Image
Jodie Gunzberg

Former Managing Director, Head of U.S. Equities

S&P Dow Jones Indices

The S&P GSCI 2015 Rebalance Preview marks a historic shift in the benchmark renowned for its world production weight.  According to this announcement of pro-forma weights, Brent crude oil is targeted take over WTI‘s status as the leading oil benchmark and the most heavily weighted commodity in the S&P GSCIThis is the first time since 1997 that a commodity other than WTI crude oil is set to be the most heavily weighted. (Natural gas was greater at times from 1994-7.)

Source: S&P Dow Jones Indices. Weights as of 12/31, except 9/30 for 2014 and target weights are shown for 2015.

In 1987, WTI was added to the S&P GSCI with a target weight of roughly 35% that declined to 32.6% by the end of that year.  Brent was added in 1999 with a weight of about 7.5%, and by that year’s end it grew to 10.9% while WTI’s weight fell to 26.3%. Since then, WTI’s weight had grown to 40.6% by June 2008 but dropped to 25.5% as of 9/30/2014, replaced quickly by Brent which continued has continued to rise to its current level of 22.9%. Its pro-forma 2015 target weight of 24.7% is almost double its 2008 weight and more than 3x its weight from initiation.

The dynamics of the crude market have changed, especially since 2010, as unconventional crude and liquids have seen an explosive growth in production from shale oil fields in Texas, North Dakota and also from increased Canadian imports. This increased supply of crude oil resulted in bottlenecks and oversupply at the Cushing pipeline nexus, which put pricing pressure on WTI. Now, pipeline capacity has been increased and transportation improved to reduce the Brent premium.  The chart below shows the premium collapse in index terms that in dollar terms translates from a high of about $20 to near parity today.

Source: S&P Dow Jones Indices. Monthly Index Levels Jan 1999 -  Sep 2014
Source: S&P Dow Jones Indices. Monthly Index Levels Jan 1999 – Sep 2014

While in the Americas, WTI crude remains the benchmark for pricing, a number of U.S. based hedgers use Brent due to its global fundamental relevance, and also since it is internationally arbitraged to U.S. refined oil product exports and oil imports. Since U.S. refined product exports and oil imports are not constrained by pipeline infrastructure, or restrictions on exporting U.S. crude, Brent futures are used as effective hedging tools. Below is a map that shows the widespread influence of Brent oil in benchmark pricing.

Source: https://www.theice.com/publicdocs/ICE_Crude_Refined_Oil_Products.pdf

Might this mean a greater opportunity for producers to hedge? Recently, the Brent curve has collapsed from bearish secular trends for the Atlantic Basin and Asia imports from West Africa. However, this puts pressure on Middle East suppliers to cut back. So there are both bull and bear pressures on Brent, making it likely range-bound – but conceivably at a lower range. More disruptions are possible and only a major one, probably from the Middle East might offset more production, especially from Saudi Arabia. Though influences from new refinery capacity in the Middle East may substitute crude supplies with products. On the upside in the short term, production growth in Lybia and Iraq is unlikely to grow fast enough to surpass disruptions from Nigeria and Venezeula.


The posts on this blog are opinions, not advice. Please read our Disclaimers.

Green Bonds, Green Projects, Green Indices and…a Greener World?

Contributor Image
Julia Kochetygova

Former Head of Sustainability Indices

S&P Dow Jones Indices

Green bonds are a recent market innovation that we first saw only a few years ago. In 2007, the European Investment Bank issued its first “green bond,” which was then followed by a similar bond from the World Bank. Together with the Oslo-based research center CICERO, The World Bank had identified a list of green topics. These topics included climate mitigation projects such as solar and wind installations, funding for new technologies that permit significant reductions in greenhouse gas (GHG) emissions and carbon reduction through reforestation and avoided deforestation. Also included were adaptation projects, such as protection against flooding, the implementation of stress-resistant agricultural systems and a few others.

Since then, the green bond market has grown rapidly at a compound annual growth rate (CAGR) of greater than 50%. With an estimated issuance exceeding USD 40 billion in 2014, compared with USD 11 billion in 2013 (and USD 5 billion in 2012), the market has expanded significantly in terms of scope, average issue size and issuer diversity. The green bond market is still relatively small, with about USD 45 billion currently outstanding versus USD 100 trillion for the global fixed income market. However, the green bond market has the potential to contribute substantially to the scale of trillions of dollars of private and public sector capital needed to combat climate change (see Exhibit 1). Many efforts are now being taken by various organizations to raise investor sensitivity to GHG-related effects.

Exhibit 1: The Road to a Low-Carbon Economy

The Road to a Low-Carbon Economy

Several questions arise in regard to this new asset class. First, how can we make sure that the green bonds are really delivering what they promise? Second, will additional pieces of the puzzle be required before we can see green bonds as a universe of its own? Third, if this group is to become a universe, what role can indexing play as part of the green investing ecosystem to attract capital at scale?

First, there are no mandatory or uniform criteria for green bonds. The green bond market, as it stands today, is “self-labeled” with voluntary issuer disclosure standards that vary in scope and quality. It is generally accepted that green bonds are required to direct their proceeds solely into projects that generate environmental, or more precisely, climate benefits. A voluntary set of guidelines (The Green Bond Principles [GBP][1]) developed by 13 industry participants in January 2014 assumes, among other things, that there is a robust project selection process according to the green criteria and that the use of proceeds is reported. Since the publication of the GBP, 49 institutions have signed up. Although the GBP only provide a voluntary framework, giving enough leeway to the issuer,compliance with them has become the cornerstone of the green bond independent verification process. This third-party verification itself forms part of the requirements, and it represents an important component of the assurance that the bond is green. Going forward, more rigorous standards can be expected to emerge.

Second, we believe that green-labeled bonds may not be all that is needed to define the green fixed income universe. There are quite a few bonds that have been issued without a green label but they have been designed to finance pure green projects, such as wind farms or solar installations. Such bonds, issued either as project finance instruments, project asset-backed securities (ABS) or corporate bonds of pure-play green companies, provide investors the opportunity to get a step closer to environmentally friendly or sustainable investing and to invest directly in projects that mitigate the impact of climate change without any reliance on a green label. We believe that the green fixed income universe would be incomplete without these bonds.

Third, why indexing becomes important for the green bond market. S&P Dow Jones Indices has launched the S&P Green Bond Index and the S&P Green Project Bond Index as separate, but integral parts of the market benchmark for the evolving green bond universe. Both indices apply a set of transparent criteria related to green assets being financed. At a specified green credit quality level, a green bond investor does not have the ability to question the capital efficiency of the associated environmental benefits (e.g., a wind farm in China versus a green REIT in the U.S.), therefore, it is important to have an opportunity to diversify across asset types and geographies. The S&P Green Bond Index aims to achieve transparency and simplicity and to aid in the commoditization of this asset class. The S&P Green Project Bond Index addresses long-term investor objectives such as liability matching, inflation protection and stable, uncorrelated, long-term yields. The two indices happen to have different credit profiles (see Exhibits 2 and 3) and correspond to the specific range of the risk/return continuum that may be a match for different investor strategies.

Exhibit 2: Credit Rating Distribution of the S&P Green Bond Index

Credit Rating Distribution of the S&P Green Bond Index

Exhibit 3: Credit Rating Distribution of the S&P Green Project Bond Index

Credit Rating Distribution of the S&P Green Project Bond Index

The combination of both of these indices may create the much-needed transparency regarding the expected and actual performance of the green assets or projects, which is important for attracting long-term, large-scale and climate sensitive capital for investments.

S&P Dow Jones Indices cordially invites you to a complimentary live webinar for investment professionals where industry experts will discuss the next steps to making green bonds a mainstream asset class. Register here.

[1]For more information, see Green Bond Principles.

The posts on this blog are opinions, not advice. Please read our Disclaimers.

First, catch a rabbit

Contributor Image
Craig Lazzara

Former Managing Director, Index Investment Strategy

S&P Dow Jones Indices

I was reminded recently of the (regrettably apocryphal) recipe for rabbit stew which began with the words “First, catch a rabbit.”  The reminder came from an article by a leading active management shop, which argued that “the more assets that flow to passive strategies, the more potential alpha there could be for successful active managers.,,, Good active managers will be able to benefit from the migration to passive.”  Supposedly, the silver lining in the growth of passive management is that there will be less competition for active returns, and fatter rewards for investors who keep the active management faith.

At a certain level, the argument is tautological.  It’s the “successful” and “good” active managers who will supposedly benefit from the growth of passive management.  How will we know who they are?  By observing, after the fact, which managers outperform their passive benchmarks.  But outperformers are always considered “successful” after the fact, regardless of how much or how little competition there is from index funds.  Can we identify successful (i.e. outperforming) active managers before the fact?

Doing so requires us to assume that active skill is both present (i.e., that the thing we’re looking for really exists) and persistent (so that historical performance will help us find it).  In fact, neither of these things is true.  Our SPIVA reports, among others, have long demonstrated that most active managers fail to beat their benchmarks most of the time.  And above-average managers in one year have only a random chance of being above average the next year.

But let’s assume, for the sake of argument, that active skill is both present and persistent.  If that were true, which active managers would lose assets to index funds?  Logically, the growth in passive management should come at the expense of the worst active managers.  This matters, because active management is a zero-sum game.  I can only be above average if someone else is below average, and the aggregate amount by which all the winners win must be exactly equal (before costs) to the aggregate amount by which the losers lose.  So when the worst active managers lose business, the aggregate amount of underperformance falls.  Therefore the aggregate outperformance available to the best active managers also falls.

By reducing the assets run by underperforming active managers, indexing reduces the rewards for those who remain.  It’s harder than ever to catch that elusive rabbit.

The posts on this blog are opinions, not advice. Please read our Disclaimers.

Risk Managing With ETF Portfolios

Contributor Image
Rick Vollaro

Chief Investment Officer

Pinnacle Advisory Group

Investment managers are always looking for ways to control risk in their portfolios, as good risk management is paramount for long term accumulation of wealth, particularly in uncertain market environments! Portfolio risk protection can be employed utilizing many different methods, each of which can be unique to a particular manager’s style and core competencies.

Structural and tactical risk management are key components to consider when constructing dynamic portfolios. Structural risk protection comes in the form of running portfolios that are diversified by and within asset class in addition to purchasing diversified baskets of securities rather than individual issues.   But good diversification is only one layer of protection and as investors have learned, it can have an inherent weakness in bear markets where correlation between asset classes can go to one at light speed. Therefore, our firm believes it is important to add a layer of tactical risk management to the structural composition of a portfolio.

One very effective tactical method to control risk is to have the freedom and flexibility to alter the broad asset allocation of the portfolios between stocks, bonds, cash, alternatives, etc.  Having the ability to dial up or down the amount of stocks or bonds in a portfolio can clearly make a material difference, and can be employed efficiently with today’s impressive selection of exchange traded funds (ETFs).

Another tactical tool that allows investors to risk manage without having to make allocation bets is to employ sector rotation. Given the explosion of high-quality ETFs in the marketplace, sector-rotation strategies can be implemented to alter US equity sectors, country exposure, fixed income sector and rate sensitivities, and commodity and currency exposures.   While sector rotation won’t take an investor out of the market, simply altering what is owned can be a material factor in returns during risky markets.

As an example, those investors that were simply willing to alter their US equity allocations and purchase defensive US sectors in their portfolios suffered less downside volatility materially than the broad market during the last two bear markets. During the last two market downturns, an investor that invested in an equal weighted composite of non-cyclical sectors (staples, healthcare, utilities, and telecom) lost an average of 13% less than S&P 500® index, and the best performing defensive sector averaged losses of roughly 20% less than the overall market.

If you are an advisor or small investor that is interested in learning more about how to use ETF portfolios to mitigate risk, join us at the S&P Dow Jones Indices event: “Navigating Market Uncertainty” on October 8th in New York City.

The posts on this blog are opinions, not advice. Please read our Disclaimers.