Get Indexology® Blog updates via email.

In This List

Russia, Where's The Wheat?

Inside the S&P 500: An Active Committee

The Dim Sum Bond Market Expanded 57% YTD in 2014

U.S. Debt Markets/CDS reaction to Argentina Credit Default

Does active management work in Europe?

Russia, Where's The Wheat?

Contributor Image
Jodie Gunzberg

Former Managing Director, Head of U.S. Equities

S&P Dow Jones Indices

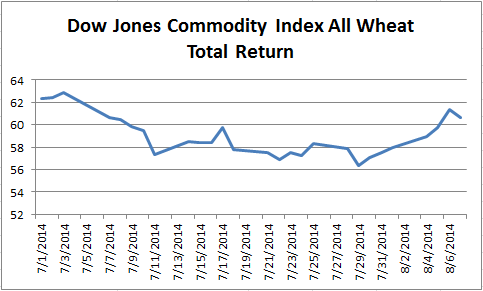
Wheat lost more than 8% in July from the near perfect weather that brought the agriculture sector down to its lowest in four years.  Now, in the first week of August the DJCI All Wheat Total Return is already up 5.4% MTD through Aug 7, despite a 1.2% loss for the day.

Source: S&P Dow Jones Indices. Data from Jul 1, 2014 to Aug 7, 2014. Past performance is not an indication of future results.

However, Russia’s food trade ban has implications that may push wheat prices up or down, depending on location. The simple economics dictate the Russian ban on food imports could raise inventories in exporting countries, which may depress local prices. On the other hand, if there is a ban on its food exports, there may be price increases in importing countries.

http://atlas.media.mit.edu/profile/hs/1001/

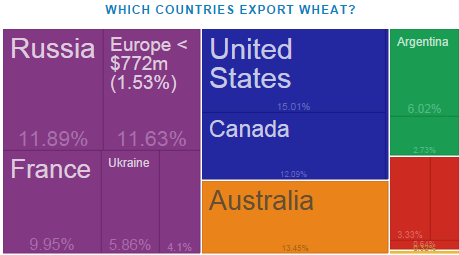
What is an important detail is that Russia, the 4th largest wheat exporter, is a big producer of competitively priced wheat that is not experiencing the same quality problems emerging in the US, Ukraine, and in the European Union from the harvest -time rains, boosting kernel sprouting that has reduced milling appeal. This means that the ban on exports may generally elevate wheat prices since the high quality, abundant, cheap wheat is being hoarded. Although the rationale is different, the impacts are similar as for cotton from China’s stockpile, and for nickel from the Indonesian ban on exports.

According to the UN FAO, cereal prices dropped 5.5% to a four-year low, “a reaction to excellent production prospects in many major producing countries and to the anticipation of abundant exportable supplies in the 2014-15 marketing season”, the agency said.

If this is the case, in order to keep prices down – all else equal – the U.S., Australia, Canada and France will need to see a strong crop to compensate for the loss of Russia’s export market.


The posts on this blog are opinions, not advice. Please read our Disclaimers.

Inside the S&P 500: An Active Committee

Contributor Image
David Blitzer

Former Managing Director and Chairman of the Index Committee

S&P Dow Jones Indices

The S&P 500 is maintained by a committee of market professionals.  We publish a detailed methodology document which includes guidelines for selecting stocks and other changes to the index.   Unlike many other S&P Dow Jones Indices and the majority of indices offered by other index providers,  there are no rigid or absolute rules for the S&P 500; the Index Committee have some discretion in selecting stocks or responding to market events.

People ask why we have a committee when other index providers manage with a rule book.  Larry Swedroe, writing on ETF.COM, unearthed an old argument that having the Index Committee means that the S&P 500 is actively managed; he concluded that this isn’t a problem.  Some years ago Bill Miller, then a well-known Legg Mason portfolio manager with a stellar record of beating the market, noted that the S&P 500’s track record of being very hard to beat suggested that active management can succeed and that the Index Committee were actually good active managers.

The Index Committee’s mission in maintaining the S&P 500 is to represent the US equity market with a focus on the large cap segment.  The Committee is not trying to pick stocks to beat the market. Rather, we use guidelines for stock selection – size, liquidity, minimum float, profitability and balance with respect to the market – to assure that the index is an accurate picture of the stock market.

If the only requirements for maintaining an index were getting the numbers right each day, a fixed rule book would suffice.  But when the market doesn’t play by the rules, a rigid rule book won’t work. The Index Committee meets on a regular schedule and monitors the index and market developments.  When guidelines or rules need to be reviewed, the Committee members understand the issues make needed changes.  More importantly, when the unexpected happens, the Index Committee can respond quickly.  Of course, the rules in a rules-based index can be re-written (and sometimes are).  But who will re-write the rules?  Are there rule-makers ready to act or does someone need to form a committee?

Looking back to the financial crisis and the weeks surrounding the collapse of Lehman Brothers was one of those unexpected moments.  Shortly after Lehman filed for bankruptcy, the news broke that the US Treasury was bailing out AIG, one of the world’s largest insurance companies.  Suddenly the Treasury owned over 90% of the company.  The S&P 500 guidelines require that any company in the index have a public float of at least 50%.  Under the rules, the index would have removed AIG.  In those scary moments, dropping AIG would have sent the markets tumbling yet again.  Given market conditions and investor fears, the Index Committee quietly set the 50% float rule aside. No trading was required. Fast forward a few years, the Treasury sold its shares back to the company and the 50% float rule was okay.

There are also other, less dramatic, cases.  Last Spring’s stock split and issue of non-voting stock by Google resulted in changes to the S&P 500. That event showed that a Committee that continuously monitors the market is essential.  When the Google action was announced, S&P DJI announced adjustments to the S&P 500 based on the index rules. Even though there was extensive news coverage of Google’s actions, major investors and index funds didn’t focus on how much trading what would be required until the schedule was published.   Then some ETF issuers raised concerns.  The Index Committee re-opened discussions, requested and received comments from many major investors and revised the treatment of Google’s split and the index rules. All this was possible only because the Committee understood the issues and was able to respond quickly.   As to rules based indices — some of them mimicked the action taken by S&P DJI’s Index Committee.

The posts on this blog are opinions, not advice. Please read our Disclaimers.

The Dim Sum Bond Market Expanded 57% YTD in 2014

Contributor Image
Michele Leung

Former Director, Fixed Income Indices

S&P Dow Jones Indices

On the back of strong issuance this year, the size of the dim sum (as known as Offshore Renminbi) bond market, that tracked by the S&P/DB ORBIT Index, rose 57% year-to-date (YTD) to currently CNH 264 billion. As shown in Exhibit 1, 68% of the dim sum bond market is composed of the credit issuers.  Note that the index targets to track the most liquid segment of the market, the bond must meet a minimum outstanding par of RMB 1 billion in order to be eligible to enter into the index.

Exhibit 1: The Sector Breakdown by Market Value

20140807_ORBIT2
Source: S&P Dow Jones Indices. Data as of August 6, 2014. Charts are provided for illustrative purposes. Past performance is no guarantee of future results. This chart may reflect hypothetical historical performance. Please see the Performance Disclosures at the end of this document for more information regarding the inherent limitations associated with back-tested performance 

The credit sector contributed most to the growth in market value; the top 5 largest issuers of this year were China Unicom, China Construction Bank, China Eastern Air, Hainan Airline and Beijing Capital. While there is an increasing concentration of Chinese credits, it is good to see some foreign names and returning issuers such as Volkswagen and Caterpillar that brought in the diversity.

According to the S&P/DB ORBIT Index, the total return rose 2.03% YTD while the yield to maturity widened by 40bps to 4.07%, as of August 6, 2014. The solid gain reflected better investor sentiment, benefited from the improving economy and the stabilizing currency. As a reference, the 5-year and 10-year China Government Bond (CGB) are trading around 3.02% and 3.81%, respectively.

Despite the concern of the deteriorating credit quality early this year, the S&P/DB ORBIT Credit Index outperformed the S&P/DB ORBIT Sovereign and Quasi-Sovereign Index, which were up 2.18% and 1.76%, respectively. Please see Exhibit 2 for the total return performance.

The yield spread between the S&P/DB ORBIT Credit Index and the S&P/DB ORBIT Sovereign and Quasi-Sovereign Index surged from 120bps at the end of last year to 159bps. It seems that while the supply remains robust, the chase for yield continues to support the market.

Exhibit 2: The Total Return Performance of the S&P/DB ORBIT Index Family

Source: S&P Dow Jones Indices.  Data as of August 6, 2014.  Charts are provided for illustrative purposes.   Past performance is no guarantee of future results.  This chart may reflect hypothetical historical performance.  Please see the Performance Disclosures at the end of this document for more information regarding the inherent limitations associated with back-tested performance.
Source: S&P Dow Jones Indices. Data as of August 6, 2014. Charts are provided for illustrative purposes. Past performance is no guarantee of future results. This chart may reflect hypothetical historical performance. Please see the Performance Disclosures at the end of this document for more information regarding the inherent limitations associated with back-tested performance.

The posts on this blog are opinions, not advice. Please read our Disclaimers.

U.S. Debt Markets/CDS reaction to Argentina Credit Default

Contributor Image
Heather Mcardle

Director, Fixed Income Indices

S&P Dow Jones Indices

On Wednesday, July 30th, S&P cut the credit rating on Argentina’s foreign currency bonds to “selective default” after they failed to reach a deal with holdout bondholders from their last default in 2001. US Treasuries initially sold off only to recover, investment grade corporate bond markets had a somewhat muted reaction, while high yield and Credit Default Swap markets widened considerably. On Friday, August 1st, ISDA ruled Argentina’s failure to pay bondholders a “credit event”.

U.S. Treasuries finished lower on Wednesday as markets expected a last minute deal to come through, decreasing the need for the safety of U.S. Treasuries. The (duration 3.92) yield closed wider on July 30th by 4 bps from 1.10% to 1.14% before tightening to 1.09% by employment Friday’s close. The S&P/BGCantor Current 10-Year U.S. Treasury Index widened 10 bps on July 30th from 2.46% to 2.56% before tightening to 2.50% due to the weaker than expected employment figures on Friday.

Corporate bonds were lower Wednesday with the S&P U.S. Investment Grade Corporate Bond Index yield widening 7 bps from 2.75% to 2.82%. U.S. Corporate CDS spreads lagged the trend, with the S&P/ISDA U.S. 150 Credit Spread Index ending mostly unchanged on Wednesday at 49.03, and widening only on Thursday July 31st to 51.44. CDS spreads widened further to Friday to 52.74 after ISDA’s decision and the employment number failed to impress.

The high yield market naturally took the most dramatic response to Argentina. The S&P U.S. Issued High Yield Corporate Bond Index yield widened only 8 bps from 5.31% to 5.39% on Wednesday, as again the market anticipated a last minute deal, only to widen further on the 31st to 5.62% and then again on Friday to 5.84% for a total move of 53 bps. High yield CDS spreads barely reacted Wednesday, with the S&P/ISDA CDS U.S. High-Yield Index widening only 1.6 bps to 278.83. Spreads caught up on Thursday widening to 292.38 and then another 5.5 bps on Friday to close at 297.89. That is 19 bps – a spike the S&P/ISDA CDS U.S. High-Yield Index has not seen since Janet Yellen’s stimulus program comments in March caused a 31 bps jump. High yield CDS spreads have snapped back since Friday, closing Monday August 4, at 292.88, 5 bps tighter.

Capture
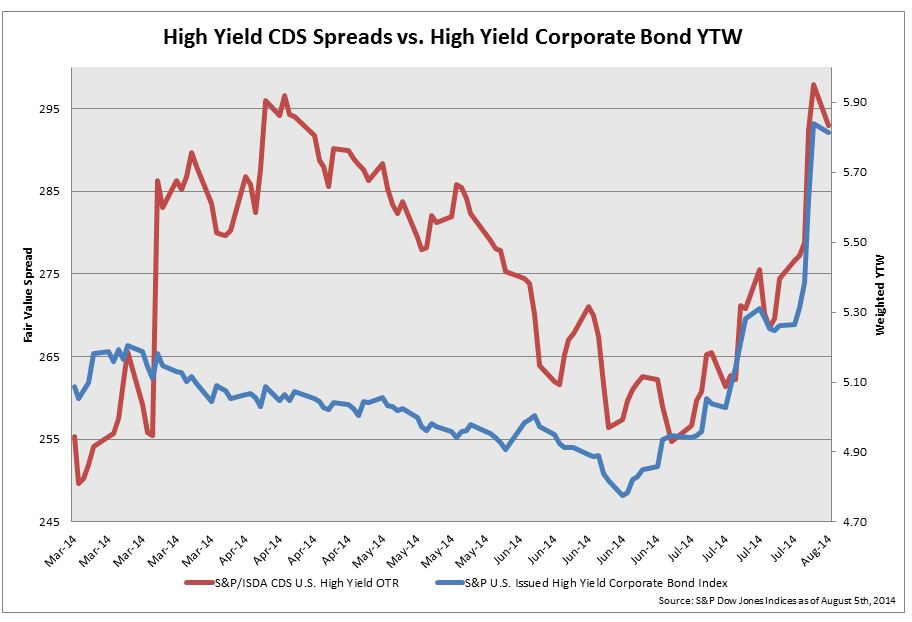
The divergence between CDS spreads and actual high yield bond yields show that the bond market has not followed CDS spreads movements due to the appetite for yield supporting the high yield market and pushing bond yields down.  Argentina’s default caused bond yields to move more in line with the direction of CDS.

The posts on this blog are opinions, not advice. Please read our Disclaimers.

Does active management work in Europe?

Contributor Image
Tim Edwards

Managing Director, Index Investment Strategy

S&P Dow Jones Indices

Academic arguments may well have “proven” the theoretical advantages of passive investing.  But theory is nothing without experiment; a comprehensive and impartial assessment of where and when active managers have delivered the promised “alpha” – or not – is a necessary and critical component of the debate.

Our S&P Index Versus Active scorecard and associated Persistence reports have – for twelve years – quantitatively examined the performance of active mutual funds in the U.S. versus their relevant benchmarks. Yet many questions regarding the global picture have so far been left unanswered, and the publication last week of the first SPIVA® scorecard dedicated to the performance of the European fund industry is accordingly of great interest.1

The overall conclusion for Europe is entirely familiar: broadly speaking, the majority of funds fail to beat their benchmarks.  However, the conclusion is more nuanced at the more granular level of country and currency fund categories; and there are certainly a few surprises:

SPIVA Europe highlights

Throughout the report –which contains analysis for multiple further categories and time periods, as well as statistics on fund survival rates – interesting themes emerge above and beyond the headline numbers.  Two conclusions of particular note are evidenced in the chart above:

  • There are pockets (time periods and markets) where active managers as a group have conclusively delivered excess returns.  In this case – nearly 7 out of 8 managers providing sterling-denominated exposure to U.K equities outperformed.
  • Such pockets may be found in surprising places.  Who amongst us would have anticipated such praise-worthy performance within the highly liquid, well-studied and notoriously efficient U.K. markets?  It is particularly remarkable in contrast to the lamentable performance of emerging market equity managers, operating in the more volatile and idiosyncratic waters that supposedly mark the domains of active preeminence.

Of course, it is tempting to speculate as to what drivers might be accountable for the curious performance of active managers in the U.K. (indeed, we’re not immune to that temptation).  However, what shouldn’t be lost is the critical observation that, at a fine enough degree of granularity and across enough time periods, one will almost certainly find places and times where active management delivered.

Moreover, such anomalies raise important further questions, which include:

This is an area of ongoing research for us, and one that we consider to be deeply important. As such, we hope you join us in welcoming the Europe SPIVA report to an increasingly lively and global debate.


1)      With the issuance of the most recent European report, there are now five regions covered including the U.S., Europe, Canada, India and Australia. The reports can be found here.


The posts on this blog are opinions, not advice. Please read our Disclaimers.