Caught between a rock and hard place – Congress, and in an election year no less (definitely a commentary, and not a company endorsed position)
Congress needs money – to spend (extending existing programs), and raising taxes only tends to be popular when the payer doesn’t pay taxes (or pays very little) or doesn’t contribute to a certain party. So one answer to ‘where do we get the money from’ is another tax repatriation holiday that permits companies to bring back cash from abroad, paying a reduced tax rate. In 2004 (the last tax repatriation holiday) the rate was 5.25% (15% of the 35% rate) and the intent was to create U.S. jobs and investments, but in retrospect few saw any job growth and what was seen was an increase in buybacks, dividends, along with another bad public relations issue for Congress (wonder if their approval rate can turn negative – you know, like bank deposit rates in the Europe). So why would Congress do it again? Well, similar to investor activists, they go to where the money is. If I use the current estimates of cash abroad, tax rates (corporate and qualified dividends) and the 2004 repatriation rate, we could feasibly be talking in the $50 billion plus area – enough to fund current projects and maybe have a little left over for a few new local pet projects (before November 4th). That money is very attractive to Congress, but also real is a potential public relations nightmare regarding giving money back to the corporations (via lower rates) and the 1%ers (let’s say the top 10% who would benefit directly from higher dividends – although a much higher portion would benefit from higher dividends via brokerage and 401k type accounts). It is not an easy choice, but neither is raising taxes or cutting programs. Good thing we have, as Will Rogers said, ‘the best Congress money can buy’ (or Ronald Reagan’s – ‘If the Congress wants to bring the Panamanian economy to its knees, why doesn’t it just go down there and run it?, or Mark Twain’s ‘Suppose you were an idiot. And suppose you were a member of Congress. But I repeat myself’, or even Warren Buffett’s ‘I could end the deficit in five minutes. You just pass a law that says that anytime there is a deficit of more than 3% of GDP all sitting members of congress are ineligible for reelection’).

Caught between a rock and hard place – Congress
Buying A Tail Wind For EPS
Is Small The New Big?
Bonds Will Need to Tread Lightly With Domestic And Global Issues
Could VEQTOR Fail to Deliver?
Caught between a rock and hard place – Congress

- Categories Equities, Fixed Income, S&P 500 & DJIA, Strategy
- Tags
Buying A Tail Wind For EPS
- Categories Equities, S&P 500 & DJIA, Strategy
- Tags
Commentary (ain’t no bodies opinion but my own):
Companies reached into their deep pockets this quarter and spent an extra $30 billion more than the prior quarter on buybacks, buying more than they issued and reducing their share count
Takeaway: companies bought a tail wind for EPS, in a quarter when they needed it most
But the question is – was the increase in buybacks just to help a weather poor Q1 or the start of a new trend
Regardless Q2,’14 already has a tail wind: Q1,’14 shares / Q2,’13 shares, even before any Q2,’14 action
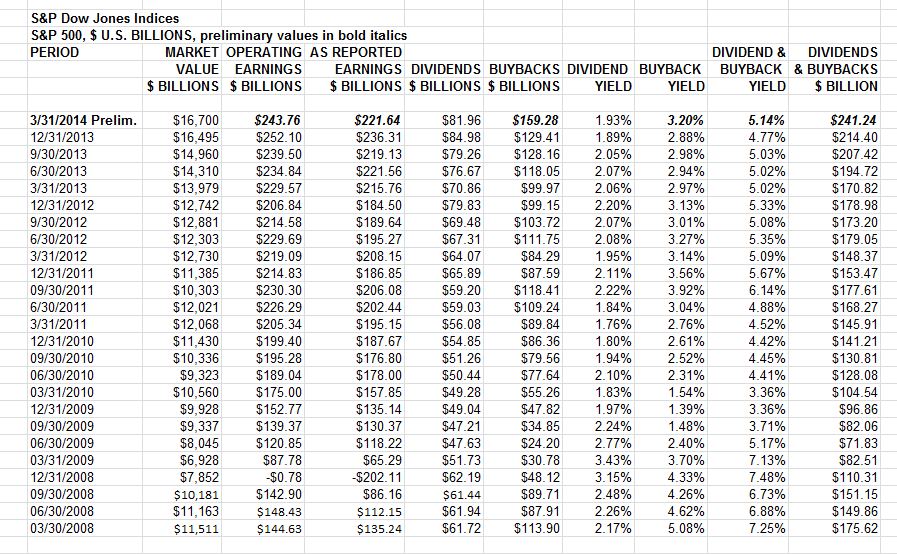
Companies continue to increase their shareholders’ returns through buybacks and cash dividends, with the two expenditures combined setting a new index record at $241.2 billion in the first quarter – surpassing the prior record of $233.2 billion set in Q3,’07
While dividend payments are historical high, the payout rate remains low, with dividends being 37% of As Reported earnings for Q1,’14 (33.8% over the last 5-years and 33.6% for estimated Q2,’14), compared to a historical average of 52% (from 1936)
Buybacks need to be measured against issuance, and the current trend (and hype) is share count reduction, resulting in enhanced EPS
I expect this trend of greater shareholder return to continue throughout 2014, as activists remain strong, interest rates low, and companies awash in cash
—————————————————–
Q1 2014 S&P 500 Buybacks (just the facts)
Q1,’14 buybacks increased 59.2% to $159.3B from Q1,’13 $100.1B, as the quarter became the second highest period
Highest was Q3,’07 at $172.0B, with #3 now being Q2,’07 with $157.7B
The expenditure gain over Q4,13’s $129.4B was 23.1%, when the average daily stock price was up only 3.7% (so the higher expenditure was not due to chasing higher prices)
Translation -> the additional $30B was used for Share Count Reduction (SCR), reducing the average diluted shares used for EPS calculation and increasing the EPS
12 month buybacks increases 29.0% to $545.9B from $414.6B (12 month high was Dec,’07 at $589.1B, recession low was 12 month Dec,’09 at $137.6 billion
Share counts go down, as companies buy more shares than they issue (it’s not just what you buy, but what you issue)
S&P announced the quarterly rebalancing last Friday, 6/13 (effective after the close this Friday, 6/20), with the S&P 500 market value reduced 0.5% due to the adjustment
For Q1,’14, 290 issues reduced their diluted share count, up from 276 in Q4,’13 and the 212 in Q1,’13, while 181 increased them, down from 185 in Q4,’13 and the 246 in Q1,’13
Significant changes of at least 1% in the quarter increased, with 123 issues reducing their count (112 in Q4,’13) and 30 increasing them at least 1% (24 in Q4,’13)
Significant changes of at least 4% for the year-over-year period, where EPS are used in comparison, increased to 99 issues from the 83 reported in Q4,’13, with 34 issues increasing their share count at least 4% (potentially diluting EPS, depending if the issuance was used for M&A which was anti-dilutive), up from 22 in Q4,’13.
Of the 404 issues that reported buybacks in Q1,’14 (up from 401 in Q4,’13), 346 of them pay a dividend (up from 339 in Q4,’13), with 217 of them (196 in Q4,’13) spending more on dividends than buybacks
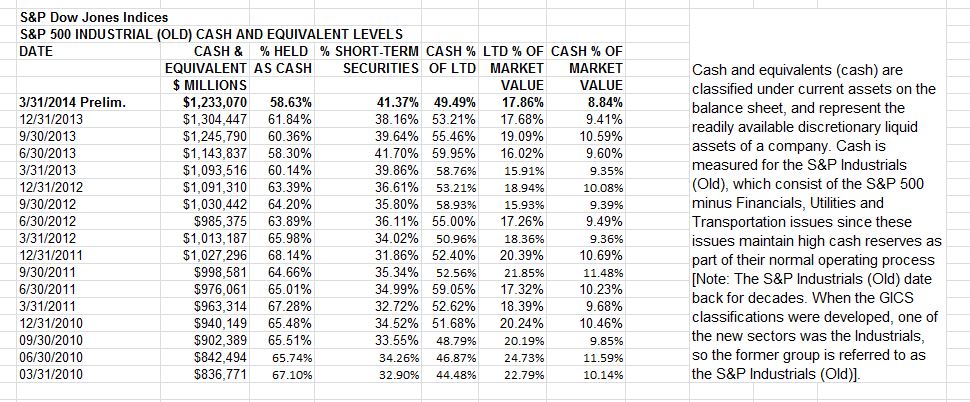
Cash (S&P 500 Industrials Old) declined after setting six quarters of consecutive record highs, as buybacks and M&A combined to reduce the holdings to $1.233 trillion from the Q4,’13 1.304 trillion record; the current level is equivalent to 90 weeks of net income siting on the books (here and abroad), earning very little, but getting a lot of attention from activists.
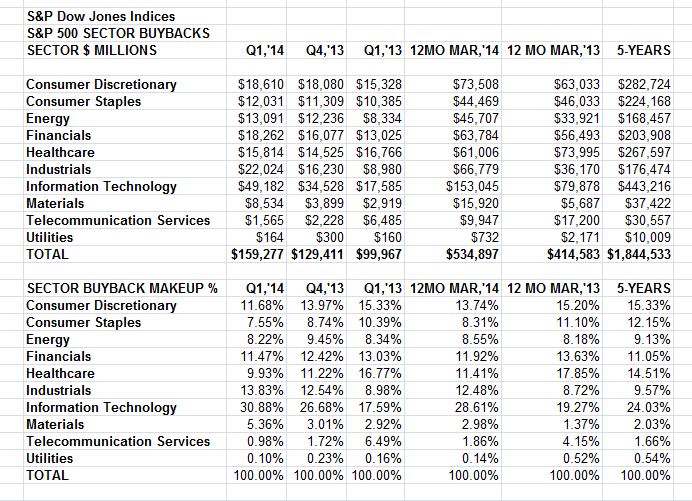
Information Technology maintained its dominance of buybacks, accounting for 30.88% of all buybacks in Q1,’14, up from 26.9% in Q4,’13
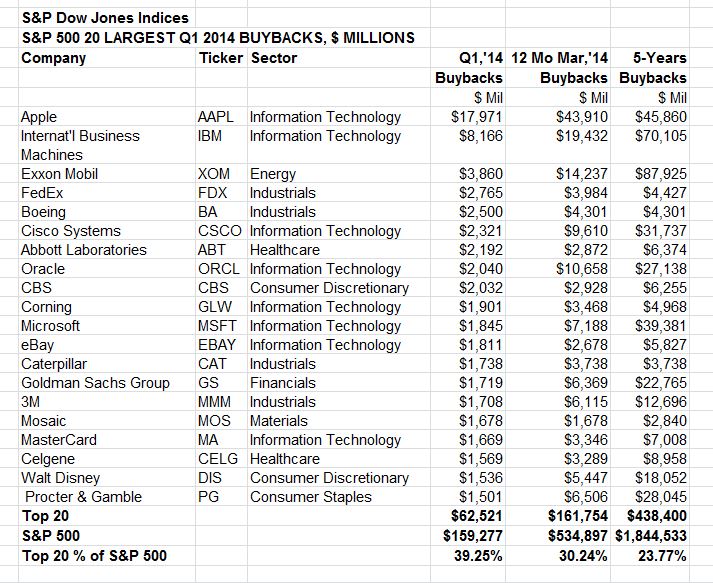
Apple set a record buyback expenditure of $18 billion in the first quarter, beating out the prior $16 billion record, which it held from Q2 2013. As a result of the large buybacks, Apple reduced its average diluted shares by 7.0% year-over-year, as it posted a 7.1% increase in net earnings, which due to a lower share count resulted in a 15.2% gain in EPS.
Is Small The New Big?

- Categories Equities, India
- Tags index, India, S&P BSE SENSEX
The recent launch of our S&P Dow Jones Indices India Index Dashboard brought to my notice the S&P BSE Small Cap Index. While the month’s report card was mostly green for the Indian indices due to the optimism in the Indian stock markets, the S&P BSE Small Cap Index did shine through.
- The S&P BSE Small Cap Index returns as on May 30, 2014 was 54.36% (based on total return index) and 51.69% (based on price index). Further, the year to date return was 37.91% while it clocked in a one-month return of 20.41%.
- During the one-year period ending May 30, 2014 the top 3 sectors attributing to this growth were Industrials, Materials and Consumer Discretionary.
- The top contributors to the growth of the index in the one year ending May 30, 2014 were PMC Fincorp Limited and Sulabh Engineers & Services Ltd. Please see the list of top 10 below.
| Security Name | Stock Price Change (%) | Stock Total Return (%) | Contribution To Index Return |
| PMC Fincorp Limited | 501.07% | 501.66% | 2.23% |
| Sulabh Engineers & Services Ltd. | 212.82% | 212.82% | 1.41% |
| Risa International Ltd. | 110.47% | 110.47% | 1.19% |
| Amtek Auto Limited | 178.94% | 179.95% | 1.12% |
| Tilak Finance Limited | 190.74% | 190.74% | 1.11% |
| CCL International Limited | 275.42% | 275.42% | 1.05% |
| Kelvin Fincap Ltd. | 254.49% | 254.49% | 1.02% |
| Sintex Industries Limited | 329.37% | 329.37% | 0.95% |
| VA Tech Wabag Limited | 155.53% | 159.54% | 0.95% |
| PTC India Limited | 97.36% | 97.36% | 0.90% |
Source: Asia Index Pvt. Ltd. Holdings Data as of S&P BSE Small Cap 31 May 2013 through 30 May 2014
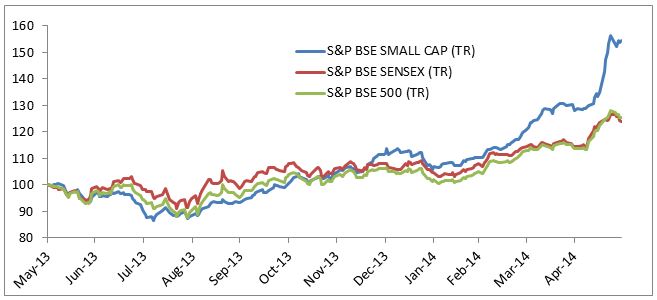
If we compare the S&P BSE Small Cap Index with the benchmark S&P BSE SENSEX or even the broad market representative S&P BSE 500 for this one year period, the outperformance to both these broad market indices is clear.
Source: Asia Index Private Limited, One year total return Performance for the period ending 30 May, 2014
| Indices | One year Total Returns % |
| S&P BSE SMALL CAP (TR) | 54.36% |
| S&P BSE SENSEX (TR) | 24.04% |
| S&P BSE 500 (TR) | 25.52% |
Source: Asia Index Private Limited. One year returns for the one year period from 31 May 2013 to 30 May 2014
| S&P BSE Small Cap Index | |
| Annualized Total Returns | 54.37% |
| Annualized Standard Deviation | 15.17% |
| Return per unit of risk | 3.58 |
The S&P BSE Small Cap performance since inception has been 23.75% (Total return performance dated April 1, 2003 to May 30, 2014)
S&P BSE Small Cap Index is definitely displaying a new trend and one always needs to put this in perspective with the long term performance statistics to gain a better understanding of overall performance.
Capturing sector performance can be easily achieved through passive investing. Passive or index Investing allows investors to gain access to such index returns with very little effort and the ability to track the trends in the sector through its historical performance. In India, the trend of index investing is just about picking up with the existing offering of index funds and ETFs.
The posts on this blog are opinions, not advice. Please read our Disclaimers.
Bonds Will Need to Tread Lightly With Domestic And Global Issues

- Categories Fixed Income
- Tags 10 year, bond, bond yields, bonds, building, corporate bond, CPI, crude oil, Empire Manufacturing, fixed income, High Yied, High Yield, housing, IMF, index investing, index performance, Industrial production, inflation, interest rates, Investment Grade, Jobless Claims, kevin horan, Manufacturiing, Middle East, permits, Philadelphia, Philly, preferred, Preferred Index, S&P 500, US treasury
- Last week saw the yield of the S&P/BGCantor Current 10 Year U.S. Treasury Bond Index close 1 basis point tighter than the 2.61% that started its week. Thursday was the only day in which the yield moved significantly as yields tightened by 5 basis points in reaction to the weaker than expected Retail Sales release. Treasury bond prices were stronger for the Monday opening as increasing tensions over the latest Iraq situation have bumped up demand for quality assets. In reaction to the situation that has been steadily increasing, oil prices were the early mover as the S&P GSCI All Crude (TR) Index saw its largest year-to-date one day jump of 2.39% last Thursday and returned 4.21% for the week. A full-on flight to safety trade has not started given the current political situation though with the suspected number of short market trades in place, if an unwinding trade were required it could have a quick and strong impact to rates. Like the Ukraine crisis, investors wait and watch to see the level of involvement required by foreign governments.
- In addition to keeping an eye on the Middle East, the forward U.S. economic calendar contains some key indicators. Today kicked off with the Empire State Manufacturing Survey stronger than expected reporting 19.28 versus the expected 15.0. Industrial Production month-over-month for May also was higher than the surveyed level of 0.5% at a 0.6%. Though today’s manufacturing and production results were muted by an announcement by the IMF (International Monetary Fund) that its U.S. growth forecast had been cut. Anticipation awaits the release of U.S. CPI on Tuesday which is expected to be a 0.2% month-over-month. This indicator has been on the rise since February’s 0.10%. Year-over-year is currently at 2% and if higher could indicate that inflation is accelerating faster than the Fed anticipated. Housing Starts (1029k, expected) and Building Permits (1050k exp.) will also be released on Wednesday. The end of the week has the largest potential to impact the markets as the Fed will conclude its meetings with its FOMC Rates Decision on Thursday. This coupled with Friday’s Initial Jobless Claims (2600k, exp.), the Philly Fed Business Outlook (14 exp.) and May’s Leading Indicators Index (0.6% exp. vs. 0.4% prior) makes for a hectic week.
- The S&P U.S. Issued High Yield Corporate Bond Index continued to outpace its investment grade counterpart by closing the week with a return of 0.25% for a year-to-date return of 5.15%. New Issuance also continued at a healthy pace as issuance in names such as DaVita Healthcare, Ferrellgas, Gibson Energy, iStar Financial and Virgolino de Oliveira Finance came to market.
- The investment grade segment of the corporate bond market also saw a significant number of new issue deals in household names such as Citigroup, Home Depot, John Deere, Johnson Controls and New York Life. The S&P U.S. Issued Investment Grade Corporate Bond Index returned 0.11% for the week which helped whittle down the negative month-to-date return of -0.61%. Year-to-date the index has returned a positive 4.86% though this is down from its end of May high of 5.64%.
- Like investment grade corporate bonds, preferred securities have given up ground as well. The S&P U.S. Preferred Stock Index’s (TR) year-to-date is down from its May month-end year-to-date high of 10.4% and has presently returned 9.73%. For the week, preferred’s returned 0.04% but are still down -0.6% for the month. The S&P 500 was also down for the week returning -0.63%, its first negative weekly return since May 9th.
Source: S&P Dow Jones Indices, Data as of 6/13/2014
The posts on this blog are opinions, not advice. Please read our Disclaimers.Could VEQTOR Fail to Deliver?

- Categories Strategy
- Tags
In my last post, I explained VEQTOR’s allocation process and purpose. Some suspicion rises about its relatively short back test history and even shorter live data. Let’s talk about its performance and discuss the scenario when it fails to deliver what it’s supposed to, that is, hedging downside risk.
VEQTOR was launched on November 18, 2009. While it didn’t live through the financial crisis, it did capture the 2011 US Treasury downgrade and has sustained the test. From July 31, 2011 to September 30, 2011, the S&P 500 index lost 12.08% in only two months. In the meantime, VEQTOR rose 13.34%. Exhibit 1 shows the performance of the S&P 500 and VEQTOR in 2011. Before the downgrade news hit the market, they both peaked on 4/29/2011. The S&P 500 bottomed out with a maximum drawdown of -18.64% on 10/3/2011 and could not restore to its April peak value until 2012, while VEQTOR hit its bottom on 8/9/2011 with a maximum drawdown of -5.37% and bounced back to its April peak value in only 9 calendar days. At the end of the year, the 500 returned only 2.11% with a volatility of 23.37% and VEQTOR posted an annual return of 17.41% with a volatility of 10.78%.
Exhibit 1: S&P 500 and VEQTOR Performance in 2011
The reason that VEQTOR held strong in 2011 despite its short back test history is that this model is based on market statistics, not on data mining. When black swan events happen, VEQTOR frame work could fail only on two possible reasons: 1) the negative correlation between equity market and its volatility breaks; or 2) VEQTOR allocation process breaks, which essentially means that the implied volatility or realized volatility signal breaks. Due to short trading history of VIX futures, we are not able to extend VEQTOR’s back test data. But we can discuss realized volatility and implied volatility in a much longer time period.
VIX was launched on January 19, 1993. To minimize any suspicion on back test, we only investigated VIX’s behavior since its launch date. Our study shows that the correlation between VIX and the S&P 500 (since January 1993) is around -73%, on par with their correlation since December 20, 2005, VEQTOR’s inception date. We do not see this negative correlation breaking any time soon which is why the S&P 500 put options are generally used to hedge their downside risk. So the next question is: will the correlation between the equity market and the VIX futures market break? The VIX futures market may not move with VIX spot all the time due to its roll cost. However, that happens mostly when VIX is hovering at its lower end. When the market is in stress (and when VEQTOR is supposed to act to the stress), VIX futures tend to go up with the spot. Roll cost tend to be overwhelmed by the spot movement, and the futures curve may even flip into backwardation and generate positive roll yield. Exhibit 2 shows the 50 biggest daily drops of the S&P 500 index and corresponding returns in the VIX spot and futures (if applicable).
Exhibit 3: S&P 500 and VIX history (1/19/1993 – 5/22/2014)
How about the VEQTOR allocation process? Would it respond to the market turbulence if it existed since 1993? We applied the allocation algorithm (minus the stop-loss feature, which has to be derived from VEQTOR index values) on those post-tech-bubble years, and got this:
Exhibit 4: Hypothetical VEQTOR Allocation After Tech Bubble Burst (7/14/2000 – 11/26/2002)
It seems that, if VIX futures were traded during that period and VEQTOR back test history could be extended, VEQTOR would have increased its allocation to VIX futures accordingly, up to 40%. Provided that the volatility-equity negative correlation held over the long term and VEQTOR allocation worked this way, chance of VEQTOR not doing its job during post-tech-bubble period seems slim.
We know this period also covered Sept-11 event. The equity market was closed for a week. After trading resumed on 9/17/2011, the S&P 500 was down by 4.89% and VIX spot went up 31.16%. If we were able to extend VEQTOR history, VEQTOR would have quickly increased its allocation to VIX from 10% to 15% the next day, and to 25% three days later.
Finally, let’s take a look at VEQTOR’s performance since its launch date (Exhibit 5). As I pointed out earlier, the VEQTOR has underperformed the equity market for the majority of the time. However, that does not negate its use as a hedging tool for equity market tail risk. We shouldn’t judge a sushi chef by his ability of making curry chicken, should we?
Exhibit 5: Performance History (11/18/2014 – 5/22/2014)
Source: S&P Dow Jones Indices. Chart is provided for illustrative purposes. Past performance is not a guarantee of future results.
The posts on this blog are opinions, not advice. Please read our Disclaimers.