Get Indexology® Blog updates via email.

In This List

U.S. Investment Grade Corporates Are Performing Well, Does A Euro Rate Cut Follow The Recent Dip?

Something’s Missing in the Housing Recovery

After May Showers, CDS Markets Are Feeling Sunny About Summer

Building the Indian Skyline

The 10-Year Treasury Yield Hits Levels Not Seen Since Last June

U.S. Investment Grade Corporates Are Performing Well, Does A Euro Rate Cut Follow The Recent Dip?

Contributor Image
Kevin Horan

Former Director, Fixed Income Indices

S&P Dow Jones Indices

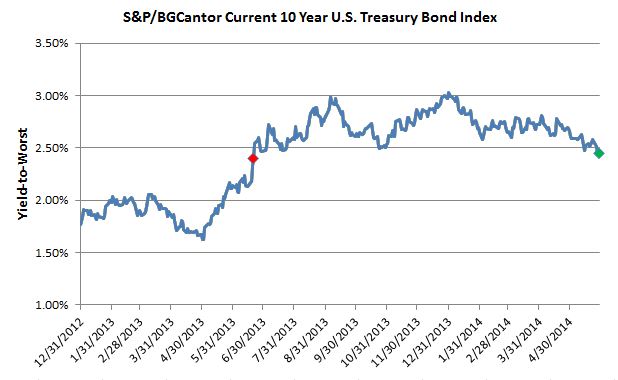
The month of May closed on a high note for bonds as the drop in yields saw the S&P/BGCantor Current 10 Year U.S. Treasury Index closed at a yield of 2.47%.  Treasuries as measured by the S&P/BGCantor U.S. Treasury Bond Index returned 0.7% for the month and 2.12% year-to-date.

As of today, the yield on the 10-year is back up to 2.52% neighborhood after dipping down to 2.4%. Last week’s rally in all sovereign bonds is looking a bit reactionary to economic growth concerns both domestic and abroad.  Focus remains on the monetary stimulus expected by the European Central Bank this week as global central banking activity has been very accommodative and does not appear to be changing any time soon.

The U.S. economic calendar for this week started today with ISM Manufacturing at 53.4 versus the expected 56.2 and ISM Prices Paid at 60 versus the expected 57.  Construction Spending for April also came at a 0.2% which was expected to be at a 0.6%.  Tomorrow’s Factory Orders (0.5%, expected) and Wednesday’s MBA Mortgage Applications (-1.2%, prior), along with ADP Employment Change (213k, exp.) and Nonfarm Productivity (-3%, exp.) will help fill in the picture.  Thursday’s Initial Jobless Claims (310k, exp.) leading into Friday’s Change in Nonfarm Payrolls (215k, exp.) and the Unemployment Rate for May (6.4%, exp.) will be key determinants to the strength, or weakness, of the labor markets.

Investment grade corporates as measured by the S&P U.S. Issued Investment Grade Corporate Bond Index performed very well as the index returned 1.36% for the month and has returned 5.49% year-to-date.  2014’s return has been the best May year-to-date return since the 7.53% return of 2002.

Both the S&P U.S. Issued High Yield Corporate Bond Index and the S&P/LSTA U.S. Leveraged Loan 100 Index ended the month of May with total returns under 1%.  The indices returned 0.99% and 0.76% respectively month-to-date.  Numerous new high yield issues continued to come to market in names such as Audatex North America Inc., Baytex Energy, Cedar Fair, Interface Master Holdings Inc. and Precision Drilling.  Year-to-date the S&P U.S. Issued High Yield Corporate Bond Index has returned 4.69% while loans is lagging behind returning 1.91%.

Last week the S&P U.S. Preferred Stock Index (TR) returned 0.73% for the week adding to the month-to-date return of 1.36% and topping out at a year-to-date return of 10.40% for the month.  Comparing this hybrid bond/equity product to the S&P 500, the performance outshines the equity index which returned 2.35% for May and 4.97% year-to-date on a total rate of return basis.


Source: S&P Dow Jones Indices, Data as of 5/30/2014, Leveraged Loan data as of 5/31/2014.

The posts on this blog are opinions, not advice. Please read our Disclaimers.

Something’s Missing in the Housing Recovery

Contributor Image
David Blitzer

Former Managing Director and Chairman of the Index Committee

S&P Dow Jones Indices

The two most popular comments about the housing recovery are that it’s weak and the reason why GDP growth is so slow.  There is some truth to both of these — the problem is new single family homes. Looking across housing, one sees surprisingly strong construction of apartments, progress in working through the backlog of foreclosures as banks sell real estate they don’t want to own and increasing sales of existing homes.  Prices of existing single family homes, helped by low mortgage rates and improved consumer confidence rose 12.5% in the year ending in March.

Capture1

All this is positive, but without growth in new single family homes, GDP growth lags.  New construction, not sales of existing homes, is what generates jobs and adds to GDP growth.  In most recoveries, the share of single family homes in housing starts (see first chart) surges. This time, there was an initial surge followed by a sharp drop.  While apartment construction is up, it has not made up the difference in housing starts which continue at about two-thirds the level we should be seeing.

Capture2

There are lots of reasons, but no one big reason for the softness. Mortgages rates are low, but banks are still reticent about loans.  Many potential home buyers may have little borrowing capacity due to recent car purchases or student debts.  The New York Times noted that the number of foreclosed homes sold by banks has been substantially greater than the number of new homes sold by builders in recent years.  While these factors will be resolved over time, there are questions about demographic shifts that could mean less building of single homes in the future.  Will people prefer renting to buying because they expect their employment to change more often or will their preferences shift to urban living from suburbia?  As the baby boomers begin to retire, will they ignore retirement communities and head to new downtowns in revived cities?  This may seem farfetched to some observers. However, suburbia and universal car ownership didn’t really exist before the Second World War, so single family homes could change again.

The posts on this blog are opinions, not advice. Please read our Disclaimers.

After May Showers, CDS Markets Are Feeling Sunny About Summer

Contributor Image
Tyler Cling

Senior Manager, Fixed Income Indices

S&P Dow Jones Indices

Over the course of a month when Mother Nature could not decide which season it was in New York City, credit market swap (CDS) market participants as a whole decided credit default insurance was too high. CDS benchmark indices like the S&P/ISDA U.S. 150 Credit Spread Index tightened 4.9%. Every sector spread that compiles the S&P/ISDA 100 CDS Index (-4.9%) was down in May, except for the U.S. S&P/ISDA CDS U.S. Consumer Staples Select 100 Index (up 1.0%). Market indicators suggest that investors believe the relative risk of insuring the underlying credits in nearly every sector has dropped, or that these underlying credits are willing to take on more risk at a lower yield.

tylerchart1

A warmer outlook and a sunny forecast often come hand in hand, however it is important to remember they are independent events. The S&P/ISDA CDS U.S. Energy Select 10 which saw the biggest drop in spreads this month, is still trading above 140 basis points (bps) on notional credit (i.e. default protection on a loan of $1 million would cost $14,000). Last week, I commented on the dichotomy of trends within the sectors the market views as riskier, as determined by default spreads.

tylerchart2

The S&P/ISDA CDS U.S. Homebuilders Select 10 Index (-9.92 bps) and S&P/ISDA CDS U.S. Consumer Discretionary Select 20 Index (-11.64 bps) sectors, tightened in May, yet continue to be priced as premium risk sectors against their cheaper peers. The health care and European banks sectors saw greater relative spread declines, at -3.09 bps and -7.5 bps, respectively; S&P/ISDA CDS U.S. Health Care Select 10 OTR Index & S&P/ISDA CDS European Banks Select 15 Index. They are trading significantly cheaper than the homebuilders and consumer discretionary sectors.

To summarize, CDS markets show that market participants are feeling warmer about the idea that underlying assets won’t default across the board than in May, but are keeping a coat nearby for certain sectors

The posts on this blog are opinions, not advice. Please read our Disclaimers.

Building the Indian Skyline

Contributor Image
Utkarsh Agrawal

Associate Director, Global Research & Design

S&P Dow Jones Indices

Since the global recession in 2008, India has been witnessing a slower real growth. Despite being a labor surplus country, India lacks adequate infrastructure to sustain the growth of labor-intensive industries which provide employment to the unskilled to semi-skilled workforce. The Global Competitiveness Index published by World Economic Forum placed India on the 3rd position for the Market size and on the 85th position for the Infrastructure in its Global Competitiveness Report 2013-2014. It also mentioned that the most problematic factor for doing business among others is the inadequate supply of infrastructure.

The development of infrastructure in a growing economy like India is very important to increase and maintain the sustainable growth rate in its real GDP which was approximately 4.35% in 2013 according to the World Economic Outlook Database April, 2014 published by the International Monetary Fund. Though investment in infrastructure as a percentage of GDP has been increasing over the years, the actual investment for the 10th plan was 5.15% of GDP and the projection for the 11th plan was 7.55% of GDP. It has been projected to be 9.95% of GDP for the 12th plan.

In the coming years, development of infrastructure should be a priority. Traditionally major share in the infrastructure development was contributed by the public sector. More and more participation of the private sector under the Public-Private Partnership is desirable to satisfy the growing needs.

The S&P BSE Infrastructure Index is an effort to measure the progress of the listed infrastructure in India. It has a targeted count of 30 stocks. The index aims to create a diversified exposure with five distinct clusters: Utilities, Energy, Transportation, Telecommunications and the Non-Banking Financial Institutions which are categorized by the Reserve Bank of India (RBI) as an ‘Infrastructure Finance Company’ or derive major business revenue from Infrastructure Finance. The clusters are based on a combination of GICS sectors. It has given an annualized return of 5.11% as on April 30, 2014 since April 28, 2006.

Disclaimer: This data is provided for illustrative purposes. Past performance does not guarantee future results.

The posts on this blog are opinions, not advice. Please read our Disclaimers.

The 10-Year Treasury Yield Hits Levels Not Seen Since Last June

Contributor Image
Kevin Horan

Former Director, Fixed Income Indices

S&P Dow Jones Indices

The last time the yield of the S&P/BGCantor Current 10 Year U.S. Treasury Bond Index was in the neighborhood of 2.4% was back in June 2013. The days of a 1% handle on rates are behind us, but the current lower rates harken back before this year. The beginning of 2014 saw yields as high as 3%. Back then, the market worried over issues such as the start and speed of Fed tapering, discussions of the timing of a rate increase, and an improving jobless claims number.  Jobless claims were at 7% and the Fed was targeting 6.5%. Yields did come lower as a crisis in Ukraine erupted and a flight to safety trade resulted. Though it first appeared to pit the superpowers of Russia and the U.S. against each other, the Ukraine crisis has been downgraded to somewhat of a skirmish as varying counties has taken diplomatic approaches to dealing with the crisis.

Some focus has always been on the speed and timing of an economic recovery. Economic releases had been slow to indicate the speed of the recovery though recent numbers have shown a growing strength in their measures. The improving economic picture was knocked for a loop when a surprise rise in Germany’s unemployment to 24,000 from the expected 15,000 became cause for concern. Such a number before the June 5 European Central Bank interest rate announcement led investors to question economic strength and the possibility of an additional rate cut in Europe.

Since then, global sovereign bonds have moved down in yield. The S&P/BGCantor Current 10 Year U.S. Treasury Bond Index closed 7 basis points lower on the day of the Germany release (May 28). The change in pace of the expected global recovery has caused traders to cover shorts put on in expectation of higher rates, thus moving price higher and yields lower. Also, benchmark investors’ have been purchasing bonds to match their index’s duration extension for the May month-end rebalancing. Though reduced from prior levels, the Fed still purchases treasury bonds and mortgage bonds as part of the ongoing stimulus.

S&P/BGCantor Current 10 Year U.S. Treasury Bond Index- Yield-to-Worst


The posts on this blog are opinions, not advice. Please read our Disclaimers.