Get Indexology® Blog updates via email.

In This List

Preferred Stock Returns 9.61% (TR)

Municipal Bonds Continue Their Climb Out of the Basement

A Review of the S&P Global Intrinsic Value Index

EU Elections - More important than you think?

Investing and keeping it Simple! Part Two

Preferred Stock Returns 9.61% (TR)

Contributor Image
J.R. Rieger

Former Head of Fixed Income Indices

S&P Dow Jones Indices

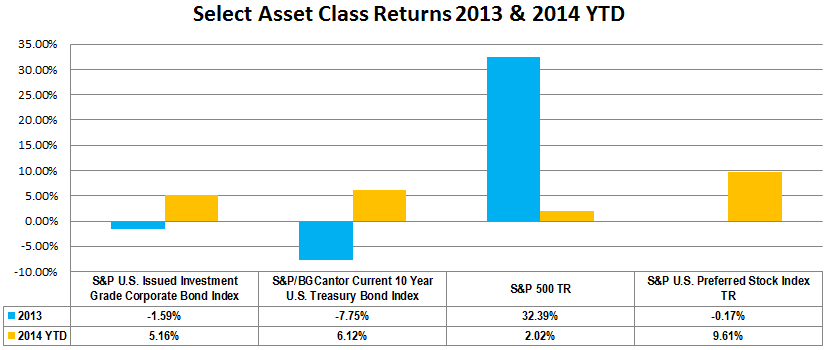
The U.S. preferred stock market is exhibiting the qualities of the hybrid equity / bond like structure they are.  Through May 15th, 2014, the S&P U.S. Preferred Stock Index has recorded a year to date total return of 9.61% mirroring more the bond market than the stock market in this low rate environment.  The index is heavily weighted in the financials sector, a sector that has seen a resurgence.  The May 16, 2014 Wall Street Journal article entitled Higher-Yielding Bank Debt Draws Interest highlights the appetite for higher yields including subordinated debt and preferred stock.  The bond like characteristics of preferred stocks seems to be rewarding investors so far in 2014.

Source: S&P Dow Jones Indices, LLC.  Data as of May 15, 2014.
Source: S&P Dow Jones Indices, LLC. Data as of May 15, 2014.

The posts on this blog are opinions, not advice. Please read our Disclaimers.

Municipal Bonds Continue Their Climb Out of the Basement

Contributor Image
J.R. Rieger

Former Head of Fixed Income Indices

S&P Dow Jones Indices

As of mid May 2014, the S&P Municipal Bond Index has returned 5.91% as the supply demand imbalance continues.  New issue supply remains comparatively low to relative to past years and munis have been enjoying a flight to quality halo despite the weaknesses shown by Detroit and Puerto Rico.   The S&P 20 Year High Grade Index has erased its 2013 losses and has returned over 13.9% year to date.

Puerto Rico General Obligations tracked in the S&P Municipal Bond Puerto Rico General Obligation Index have rebounded positively in 2014 but may have peaked in recent days as the market has shown little indication of continued forward progress.   The weighted average yield of the index has been hovering around 7.67% and 7.73% for the month to date without a major move in either direction. The Puerto Rico bond market has a long way to go to offset it’s 2013 losses of over 20%. Source: S&P Dow Jones Indices, LLC.  Data as of May 15, 2014.

Source: S&P Dow Jones Indices, LLC. Data as of May 15, 2014.

The posts on this blog are opinions, not advice. Please read our Disclaimers.

A Review of the S&P Global Intrinsic Value Index

Contributor Image
Alka Banerjee

Former Managing Director, Product Management

S&P Dow Jones Indices

The recently published research paper on S&P GIVI®: Factor Investing: A Review of the S&P Global Intrinsic Value Index analyzes in detail the source of GIVI returns globally and regionally. S&P GIVI is a multi-factor global index which provides exposure to low volatility and the value factors by removing 30% of the highest beta stocks in each country and weighting the rest of the stocks by their intrinsic value. The case for factor investing has gathered momentum post the 2008 crisis when it became clear that diversification by sector, geography and size was not sufficient and factor diversification was equally essential. S&P GIVI launched in March 2012 and we now have almost two years of live performance data and back tested data for 13 years prior to 2012. Analyzing the live data we see immediately the benefit of low volatility in emerging markets which have seen severe volatility recently (Figure 1). In the US where markets have seen a sharp rise, the drag effect of a low volatility approach is negated by the value tilt which is experiencing a strong uptick (Figure 2).

Review of GIVI_Figure 1

Review of GIVI_Figure 2

The full period (2000-2013) Sharpe ratio of the S&P GIVI Global is 0.46 which compares favorably with a Sharpe ratio of 0.17 for the corresponding market capitalization- weighted S&P Global BMI (Figure 3). While the performance gap shrinks when we examine shorter and more recent time periods, the S&P GIVI Global either matches or outperforms the S&P Global BMI during the corresponding time periods. The S&P GIVI Developed clearly outperforms the S&P Global BMI in every time period examined (Figure 4).

Review of GIVI_Figure 3

Review of GIVI_Figure 4

The research paper shows the impact of using portfolios in a sequential fashion starting with a portfolio which is 100% intrinsically value weighted and progressively allocating in increments of 10% a portfolio of low beta stocks with the final portfolio being 100% low beta and no allocation to intrinsic value weighting. The most interesting observation was that the S&P GIVI Global matched or outperformed each of these combinations over each time period measured (Figure 5).

Review of GIVI_Figure 5

S&P GIVI allows investors to invest in two factors simultaneously without worrying about the right allocation mix in a cost efficient manner. Exposure to low volatility and value provides a diversification from regular market capitalization weighted indices, with downside protection in time of downturn and potential for growth in up markets.

Watch the S&P GIVI video now and find out more about GIVI returns globally and regionally. bit.ly/1v9fYHD

The posts on this blog are opinions, not advice. Please read our Disclaimers.

EU Elections - More important than you think?

Contributor Image
Tim Edwards

Managing Director, Index Investment Strategy

S&P Dow Jones Indices

The coming week will provide Europeans with a chance to vote in the 2014 EU parliament elections. Nationally and internationally, the contest is viewed as somewhat moot; the majority across the EU will most likely not even vote.

But whilst voters in the EU elections are not voting for members of the ECB or its president Mario Draghi, the European central bank IS directly governed by the laws of the EU parliament. With laws defining a financial transaction tax, bank regulation and a potential banking union all on the immediate agenda for the EU, the outcome may be more important than the minimal degree a low turnout and sparse media coverage implies.

At the time of the last elections (held between 4 and 7 June 2009), the EU exhorted citizens to vote with campaigns with titles such as “How much should we tame financial markets?”. Since then, in price terms, the S&P Europe 350 index of large-cap stocks is up by over two thirds. And, whilst the markets were not “tamed” entirely, volatility has certainly come down:

S&P Europe 350 price return and volatility, May 2009 – May 20145 years of EU

Source: S&P Dow Jones Indices, May 2014. Charts are provided for illustrative purposes only. Past performance is no guarantee of future results.


Most equity investors would not be disappointed with such returns  including the effects of dividends before tax, the gross total return of the S&P Europe 350 was 100% – but investing is a relative game. If you had decamped to the U.S. markets and the S&P 500 in particular, as many did during the Eurozone crisis, you would have done better.

versus US

Source: S&P Dow Jones Indices, May 2014. Tables are provided for illustrative purposes only. Past performance is no guarantee of future results.


More recently, Europe-focused ETFs listed in the U.S. saw large inflows and flows from U.S. investors to European stocks have been tilted in favour of the latter since the new year. Why are those outside Europe now buying in? 

Value is part of the answer: after five years of stellar performance, valuations in the U.S. have risen too; and by a greater extent than their underperforming European equivalents. So by now on most measures of “value” Europe certainly looks “cheaper” than the U.S.

But it is not just U.S. value investors who are attracted. The considerable fillip to the U.S. markets provided by tens of billions of monthly bond purchases by the Fed’s stimulus program looks likely to be wound down by the coming October; interest rates are predicted to rise shortly thereafter. The ECB has so far only provided oral guarantees supporting the Euro (“whatever it takes”). And while the ECB does not look set to make a surprise announcement of anything like the U.S. program; the prospect of deflation has brought on more bullish talk. The ECB has also relied less on signalling their intentions than the Fed, a consequence of which is greater uncertainty.

Judging by the experience of Japan and the U.S., expanded fiscal stimulus in Europe will likely boost the equity markets in its wake.  Those investors who won’t “fight the Fed” – and those flocked to Japan early last year – will be watching Europe closely. It is impossible for us to predict who will do better out of Europe or the U.S. over the next five years. But we can certainly understand why U.S. investors are looking to Europe at present. 

Ultimately, the role and composition of pan-EU institutions impacts the demand from international investors for equity markets in the region.The winners of the 2009 elections, still reeling from a financial crisis, were shortly served a potent cocktail of challenges to the integrity, currency, credit and economic future of the region via the Eurozone crisis. The challenges ahead will hopefully not prove equally testing, but for their impacts on the financial markets alone, these elections may well prove important.

The posts on this blog are opinions, not advice. Please read our Disclaimers.

Investing and keeping it Simple! Part Two

Contributor Image
Koel Ghosh

Former Head of South Asia

S&P Dow Jones Indices

The ongoing debate around the inadequate financial literacy in this country continues. We often  attribute this to the slow growth of our mutual fund industry, which still have a sea of investors who need to wake up to understanding the benefits of this industry. I ran a quick poll in my personal network of family & friends who are working professionals, many of whom belong to financial industry, asking the basic question “Where do you invest?” It’s surprising to hear that they too are busy in their day to day activities to park their savings in viable options. Direct equities are not a favorite among them as it’s not possible to diligently monitor the daily market movement. This is where awareness of the benefits of passive investing could be an eye opener.

The S&P BSE SENSEX in the last year has given a return of 20.73 % (One year Total Return as on 31st March, 2014), that is if we are looking at just plain vanilla market returns. The advantages in index returns are that there is no monitoring, it’s predictable and there is history on performance so your expectations are managed. The S&P BSE SENSEX provides you with the average market return, which comparatively, would seem more beneficial than savings bank or fixed deposits returns which are in fact net negative returns, if one were to discount  them by the ongoing inflation rate.  Index Investing also provides scope for diversification- sectors, themes, asset allocation strategies and if one were not interested in equities, there is also fixed income.

Source: Asia Index Private Limited

India currently has 25 Index Funds and nearly 39 ETFs. Minuscule compared to the global scenario, but a good range to choose from this growing trend. The government is providing necessary incentives to investors via tax incentives to first-time investors, reduction in STT on equity ETFs and inclusion of ETFs for the Rajiv Gandhi Tax Savings Scheme.

The incentive and options are actively being provided to create awareness on the various options and to ensure one recognizes the opportunity that lies ahead to make regular investing a habit. It is that simple!


The posts on this blog are opinions, not advice. Please read our Disclaimers.