Get Indexology® Blog updates via email.

In This List

A Review of the S&P Global Intrinsic Value Index

EU Elections - More important than you think?

Investing and keeping it Simple! Part Two

Alternative Futures: Fund Management and Indexing

Will This Week’s Upcoming Economic Signals Dampen the Performance of Longer Maturity Investments?

A Review of the S&P Global Intrinsic Value Index

Contributor Image
Alka Banerjee

Former Managing Director, Product Management

S&P Dow Jones Indices

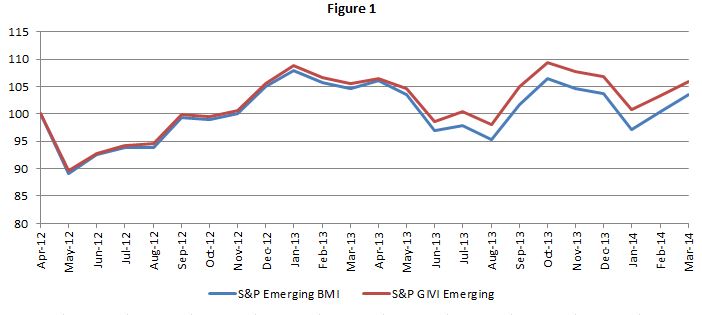
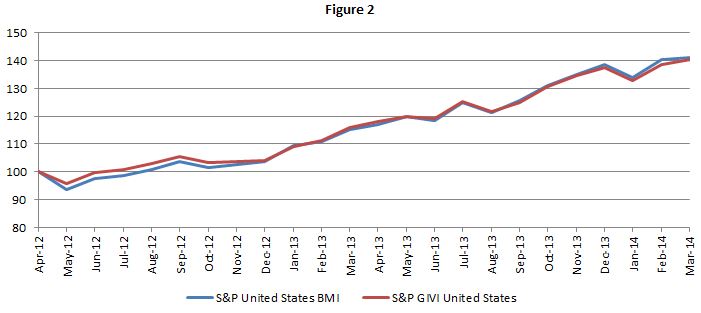
The recently published research paper on S&P GIVI®: Factor Investing: A Review of the S&P Global Intrinsic Value Index analyzes in detail the source of GIVI returns globally and regionally. S&P GIVI is a multi-factor global index which provides exposure to low volatility and the value factors by removing 30% of the highest beta stocks in each country and weighting the rest of the stocks by their intrinsic value. The case for factor investing has gathered momentum post the 2008 crisis when it became clear that diversification by sector, geography and size was not sufficient and factor diversification was equally essential. S&P GIVI launched in March 2012 and we now have almost two years of live performance data and back tested data for 13 years prior to 2012. Analyzing the live data we see immediately the benefit of low volatility in emerging markets which have seen severe volatility recently (Figure 1). In the US where markets have seen a sharp rise, the drag effect of a low volatility approach is negated by the value tilt which is experiencing a strong uptick (Figure 2).

Review of GIVI_Figure 1

Review of GIVI_Figure 2

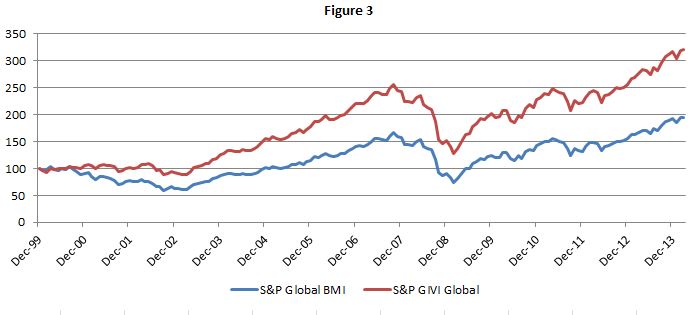
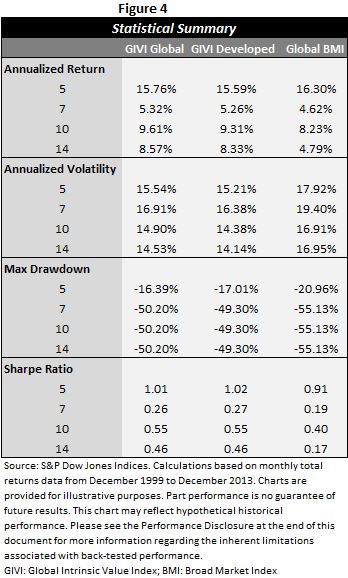
The full period (2000-2013) Sharpe ratio of the S&P GIVI Global is 0.46 which compares favorably with a Sharpe ratio of 0.17 for the corresponding market capitalization- weighted S&P Global BMI (Figure 3). While the performance gap shrinks when we examine shorter and more recent time periods, the S&P GIVI Global either matches or outperforms the S&P Global BMI during the corresponding time periods. The S&P GIVI Developed clearly outperforms the S&P Global BMI in every time period examined (Figure 4).

Review of GIVI_Figure 3

Review of GIVI_Figure 4

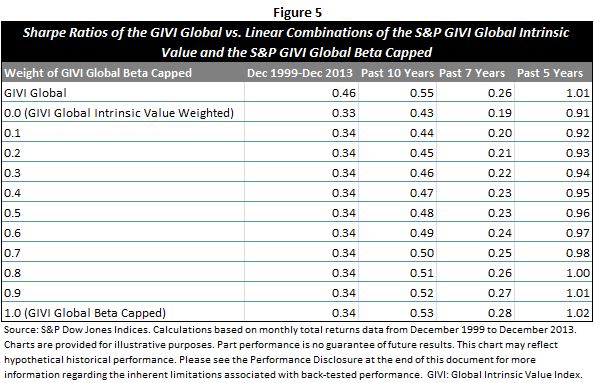
The research paper shows the impact of using portfolios in a sequential fashion starting with a portfolio which is 100% intrinsically value weighted and progressively allocating in increments of 10% a portfolio of low beta stocks with the final portfolio being 100% low beta and no allocation to intrinsic value weighting. The most interesting observation was that the S&P GIVI Global matched or outperformed each of these combinations over each time period measured (Figure 5).

Review of GIVI_Figure 5

S&P GIVI allows investors to invest in two factors simultaneously without worrying about the right allocation mix in a cost efficient manner. Exposure to low volatility and value provides a diversification from regular market capitalization weighted indices, with downside protection in time of downturn and potential for growth in up markets.

Watch the S&P GIVI video now and find out more about GIVI returns globally and regionally. bit.ly/1v9fYHD

The posts on this blog are opinions, not advice. Please read our Disclaimers.

EU Elections - More important than you think?

Contributor Image
Tim Edwards

Managing Director, Index Investment Strategy

S&P Dow Jones Indices

The coming week will provide Europeans with a chance to vote in the 2014 EU parliament elections. Nationally and internationally, the contest is viewed as somewhat moot; the majority across the EU will most likely not even vote.

But whilst voters in the EU elections are not voting for members of the ECB or its president Mario Draghi, the European central bank IS directly governed by the laws of the EU parliament. With laws defining a financial transaction tax, bank regulation and a potential banking union all on the immediate agenda for the EU, the outcome may be more important than the minimal degree a low turnout and sparse media coverage implies.

At the time of the last elections (held between 4 and 7 June 2009), the EU exhorted citizens to vote with campaigns with titles such as “How much should we tame financial markets?”. Since then, in price terms, the S&P Europe 350 index of large-cap stocks is up by over two thirds. And, whilst the markets were not “tamed” entirely, volatility has certainly come down:

S&P Europe 350 price return and volatility, May 2009 – May 20145 years of EU

Source: S&P Dow Jones Indices, May 2014. Charts are provided for illustrative purposes only. Past performance is no guarantee of future results.


Most equity investors would not be disappointed with such returns  including the effects of dividends before tax, the gross total return of the S&P Europe 350 was 100% – but investing is a relative game. If you had decamped to the U.S. markets and the S&P 500 in particular, as many did during the Eurozone crisis, you would have done better.

versus US

Source: S&P Dow Jones Indices, May 2014. Tables are provided for illustrative purposes only. Past performance is no guarantee of future results.


More recently, Europe-focused ETFs listed in the U.S. saw large inflows and flows from U.S. investors to European stocks have been tilted in favour of the latter since the new year. Why are those outside Europe now buying in? 

Value is part of the answer: after five years of stellar performance, valuations in the U.S. have risen too; and by a greater extent than their underperforming European equivalents. So by now on most measures of “value” Europe certainly looks “cheaper” than the U.S.

But it is not just U.S. value investors who are attracted. The considerable fillip to the U.S. markets provided by tens of billions of monthly bond purchases by the Fed’s stimulus program looks likely to be wound down by the coming October; interest rates are predicted to rise shortly thereafter. The ECB has so far only provided oral guarantees supporting the Euro (“whatever it takes”). And while the ECB does not look set to make a surprise announcement of anything like the U.S. program; the prospect of deflation has brought on more bullish talk. The ECB has also relied less on signalling their intentions than the Fed, a consequence of which is greater uncertainty.

Judging by the experience of Japan and the U.S., expanded fiscal stimulus in Europe will likely boost the equity markets in its wake.  Those investors who won’t “fight the Fed” – and those flocked to Japan early last year – will be watching Europe closely. It is impossible for us to predict who will do better out of Europe or the U.S. over the next five years. But we can certainly understand why U.S. investors are looking to Europe at present. 

Ultimately, the role and composition of pan-EU institutions impacts the demand from international investors for equity markets in the region.The winners of the 2009 elections, still reeling from a financial crisis, were shortly served a potent cocktail of challenges to the integrity, currency, credit and economic future of the region via the Eurozone crisis. The challenges ahead will hopefully not prove equally testing, but for their impacts on the financial markets alone, these elections may well prove important.

The posts on this blog are opinions, not advice. Please read our Disclaimers.

Investing and keeping it Simple! Part Two

Contributor Image
Koel Ghosh

Former Head of South Asia

S&P Dow Jones Indices

The ongoing debate around the inadequate financial literacy in this country continues. We often  attribute this to the slow growth of our mutual fund industry, which still have a sea of investors who need to wake up to understanding the benefits of this industry. I ran a quick poll in my personal network of family & friends who are working professionals, many of whom belong to financial industry, asking the basic question “Where do you invest?” It’s surprising to hear that they too are busy in their day to day activities to park their savings in viable options. Direct equities are not a favorite among them as it’s not possible to diligently monitor the daily market movement. This is where awareness of the benefits of passive investing could be an eye opener.

The S&P BSE SENSEX in the last year has given a return of 20.73 % (One year Total Return as on 31st March, 2014), that is if we are looking at just plain vanilla market returns. The advantages in index returns are that there is no monitoring, it’s predictable and there is history on performance so your expectations are managed. The S&P BSE SENSEX provides you with the average market return, which comparatively, would seem more beneficial than savings bank or fixed deposits returns which are in fact net negative returns, if one were to discount  them by the ongoing inflation rate.  Index Investing also provides scope for diversification- sectors, themes, asset allocation strategies and if one were not interested in equities, there is also fixed income.

Source: Asia Index Private Limited

India currently has 25 Index Funds and nearly 39 ETFs. Minuscule compared to the global scenario, but a good range to choose from this growing trend. The government is providing necessary incentives to investors via tax incentives to first-time investors, reduction in STT on equity ETFs and inclusion of ETFs for the Rajiv Gandhi Tax Savings Scheme.

The incentive and options are actively being provided to create awareness on the various options and to ensure one recognizes the opportunity that lies ahead to make regular investing a habit. It is that simple!


The posts on this blog are opinions, not advice. Please read our Disclaimers.

Alternative Futures: Fund Management and Indexing

Contributor Image
David Blitzer

Former Managing Director and Chairman of the Index Committee

S&P Dow Jones Indices

In the last two weeks two mainstays of the British and global business press – The Economist and the Financial Times have argued strongly that indexing as an investment approach will overtake active management. The Economist (articles here and here) and the FT in its FTfm  section on fund management (here and here) point to the lower fees typically charged for investment products based on indices as the key reason.  It quotes Warren Buffet’s advice to his trustees of his (future) estate to put 10% in cash and 90% in a “very low cost S&P 500 index fund.”  The article cites the growth in index investing’s market share among both individual and institutional investors, citing the continuing strong gains by ETFs as a key driver.  Other contributors to the expanded use of index-based investments are regulations in Britain and other countries abolishing or limiting commissions earned by financial advisors. As asset-based fees replace transaction-based commissions, advisors join with clients in seeking minimal cost approaches.  The increased interest in focused ETFs and “alternative beta” are also encouraging more investors to consider index-based approaches.

In FTfm¸ the FT’s voice on the fund management, an editorial and an article appeared on a report from the UK’s Department for Communities and Local Government arguing that local government pension funds are wasting money on active management fees.

There was a time when either people doubted the numerical evidence that index-based investments and their lower fees tend to out-perform the typical asset manager or simply claimed that no one wanted to be marked as average or ordinary by investing in and index fund.  The data in S&P DJI’s SPIVA reports and other analyses tell the story.  As noted by the Economist, new approaches to indexing are also supporting the growth of index-based investment products.

The posts on this blog are opinions, not advice. Please read our Disclaimers.

Will This Week’s Upcoming Economic Signals Dampen the Performance of Longer Maturity Investments?

Contributor Image
Kevin Horan

Former Director, Fixed Income Indices

S&P Dow Jones Indices

The week ahead should be a busy one with a number of economic indicators scheduled for this week.  Monday starts with a less relevant number, the Treasuries Federal Budget Summary ($106.9bn actual versus $114bn, expected) leading into the more important April Retail Sales (0.4% expected) which after a revision on last month’s number up to 1.2% compared to the expected number could bring some surprise.  Other important indicators of the week will be the MBA Mortgage Applications (5.3% prior), April’s PPI (Producer Price Index, 0.2% expected) and the monthly CPI (Consumer Price Index, 0.3% expected).  Jobless Claims (320k exp.), Industrial Production (unchanged, exp.), Philadelphia Fed Business Outlook (14 exp.), Housing Starts (980k, exp.) and the University of Michigan Confidence Survey (84.5, exp.) all will shed some focus on the strength of the economy and have the potential to surprise the markets.

Last week saw the yield on the 10-year U.S. Treasury unchanged as the yield closed the week at a 2.59% as measured by the S&P/BGCantor Current 10 Year U.S. Treasury Index.  The long end of the curve has been the top performer as the S&P/BGCantor Current 20+ Year U.S. Treasury Index returns 10.90% YTD.  It remains to be seen if this trend continues after the U.S. curve has flattened by 52 basis points as measured by the yield of the S&P/BGCantor Current 30 Year U.S. Treasury Index.

The duration matched spread to Treasuries or the OAS (Option Adjusted Spread) for both the S&P U.S. Issued Investment Grade Corporate Bond Index and the S&P U.S. Issued High Yield Corporate Bond Index are tighter by 16 and 33 basis points respectively.  For the month of May to date, the OAS for high yield is 4 basis points tighter while investment grades are just wider by 2 basis points.  As for their total rate of return performance, these indices are close month-to-date as investment grade returned 0.31% and high yield is at 0.34%.  Year-to-date, the investment grade is still outperforming high yield by returning 4.39% versus 4.01%.

The loan market continued to maintain a healthier tone from last week relative to earlier in the start of the year.  The S&P/LSTA U.S. Leveraged Loan 100 Index has returned 0.29% month-to-date and 1.42% year-to-date.  Bankers indicate a busy pace again this week, with a number of energy-related offerings planned alongside industrial and media deals.

Preferreds continued their run as the S&P U.S. Preferred Stock Index [TR] returned 0.15% for the week.  Month-to-date this index returned 0.37% and is a standout with a year-to-date return of 9.32%.


Source: S&P Dow Jones Indices, Data as of 5/9/2014, Leveraged Loan data as of 5/11/2014.

The posts on this blog are opinions, not advice. Please read our Disclaimers.