Get Indexology® Blog updates via email.

In This List

Another Fuel In The Fire: The Base Case

Is Gold A Good Hedge For Your Home?

A Comparison of Two Corporate Bond Markets

Corporate Bond Funds: Weighing performance scenarios

Applying a Laddering Strategy to Preferred Portfolios in Canada

Another Fuel In The Fire: The Base Case

Contributor Image
Jodie Gunzberg

Former Managing Director, Head of U.S. Equities

S&P Dow Jones Indices

Finally, in April, commodities got hot enough to turn around even the base metals (also known as the industrial metals,) up 1.8% for the month. Although this comeback is not driven by the main supply shocks we are experiencing in energy and agriculture, it is fundamental in nature.  China’s State Reserves Bureau (SRB) is now buying copper in a big way for the first time since 2009.  Also, Indonesia‘s ban on exports of nickel ore has driven it to be the best YTD performer in the S&P GSCI, up 31.6%, only behind coffee, which has gained 81.0%.

While nickel has been up all year, its performance was exceptional in April with a gain of 15.2%, the biggest in the S&P GSCI for the month. All of the other commodities in the base metals sector were also positive with the exception of copper, which has at least stopped bleeding with 0.0% return in April.  It seems the copper buying has overtaken the fears of slowing Chinese demand growth and credit weakness, and again, is not very highly related to Chinese GDP growth.

What is most interesting about the current performance and term structure of base metals is that the performance turned positive this month and term structure is becoming less in contango. The roll yield, a measure of term structure, is now costing only 90 basis points for the year thus far. This is the lowest since 2007 when the last streak of backwardation ended in the sector.  In fact, going back as far as 1978, there were only two periods when the base metals were in backwardation, 1987-90 and 2004-07.

Source: S&P Dow Jones Indices and Bloomberg. Data from Jan 1978 to April 2014. Past performance is not an indication of future results. This chart reflects hypothetical historical performance. Please note that any information prior to the launch of the index is considered hypothetical historical performance (backtesting).  Backtested performance is not actual performance and there are a number of inherent limitations associated with backtested performance, including the fact that backtested calculations are generally prepared with the benefit of hindsight.

In these periods the average annual premium was 17.9%  with an average return annually of 49.7%. The majority of times for the S&P GSCI Industrial Metals are in contango with an average cost of 5.2%. However, when there is backwardation, it is potent as you can see especially in the 80’s when the sector was up 560.5%, more than three times the still attractive 164.0% just before the crisis.  In these times, the S&P GSCI Total Return was up 182.6% and 65.9%, respectively.

Now may be the turning point for the base metals given the flattening term structure driven by supply shocks and demand pickup. If this is the case, it may just be another fuel in the fire for commodities this year.


Source: S&P Dow Jones Indices and Bloomberg. Data from Jan 1978 to April 2014. Past performance is not an indication of future results. This chart reflects hypothetical historical performance. Please note that any information prior to the launch of the index is considered hypothetical historical performance (backtesting). Backtested performance is not actual performance and there are a number of inherent limitations associated with backtested performance, including the fact that backtested calculations are generally prepared with the benefit of hindsight.

The posts on this blog are opinions, not advice. Please read our Disclaimers.

Is Gold A Good Hedge For Your Home?

Contributor Image
Marya Alsati

Former Product Manager, Commodities, Home Prices, and Real Assets

S&P Dow Jones Indices

Gold, traditionally, has been perceived as a safe haven that investors flock to during periods of uncertainty and high inflation. The question we are interested in examining is whether or not the safe-haven argument holds true for protecting against homes’ falling prices.

Home prices are generally considered a leading economic indicator since a drop in housing prices implies excess demand and houses being overvalued. Price declines can reduce homeowner’s wealth and employment opportunities in the construction sector as well as government resources through the reduction in property taxes collected.

Gold and home prices, with regard to this post are represented by the S&P Case-Shriller 10-City Home Price Index and the S&P GSCI® Gold.

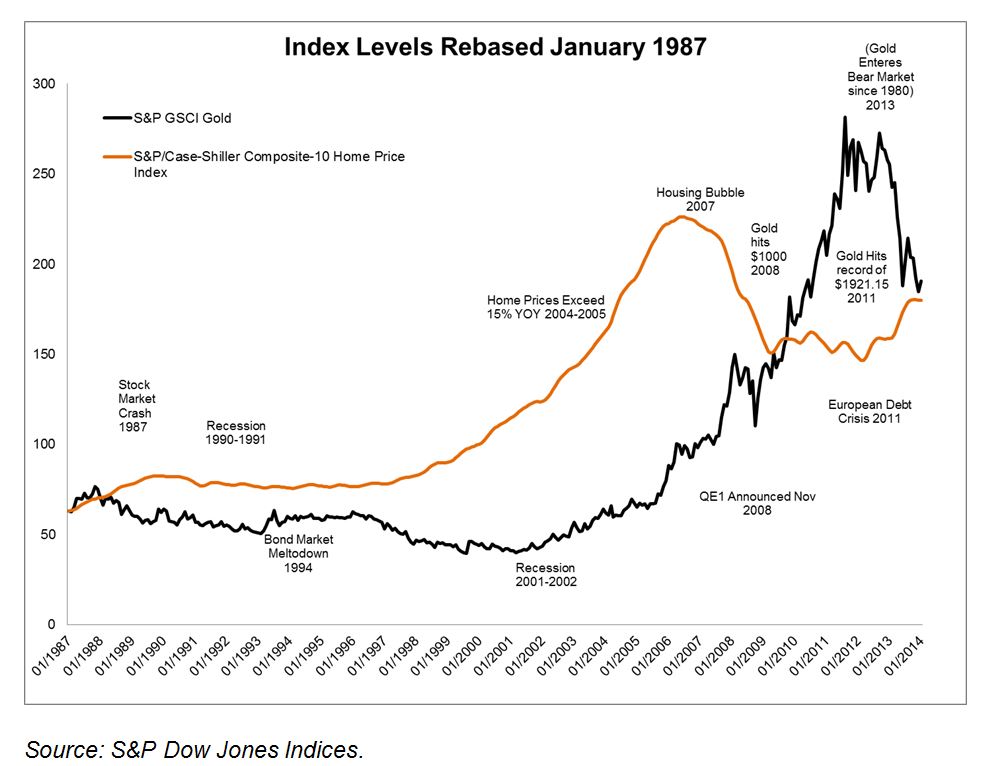
The chart below depicts the index levels – rebased on January 1987- of the gold and home price indices. It can be seen that during the housing trough in 2011, gold peaked. In fact, during that time period, physical gold reached a record high of $1,921 per ounce.


Index Levels Rebased January 1987

The chart below illustrates the year–over-year returns of the S&P Case-Shiller 10-City Home Price Index and the S&P GSCI Gold. Not taking into account the period between 2001 and 2006, yearly returns moved in opposite directions. During the 2001-2006 period, interest rates were historically low and reached a record 1% in 2001. In short, low interest rates make housing more affordable, driving up demand and prices. Low interest rates also make gold investments more attractive, which again drives prices up. In addition during that time period demand for physical gold from China was strong due to its strengthening economy.

Capture2

Out of the 27 year period covered in the analysis for this post, home prices had 10 annual year-to-date declines. Within the same time frame gold prices recorded seven year-to-date increases. See table below.

Capture

Will your floors be paved with Gold?


Source: S&P Dow Jones Indices and Bloomberg. Data from Jan 1987 to December 2013.. Past performance is not an indication of future results. This chart reflects hypothetical historical performance. Please note that any information prior to the launch of the index is considered hypothetical historical performance (backtesting). Backtested performance is not actual performance and there are a number of inherent limitations associated with backtested performance, including the fact that backtested calculations are generally prepared with the benefit of hindsight.

The posts on this blog are opinions, not advice. Please read our Disclaimers.

A Comparison of Two Corporate Bond Markets

Contributor Image
Michele Leung

Former Director, Fixed Income Indices

S&P Dow Jones Indices

The possibility of interest rates remaining low means investors will continue to search for yield while also looking to diversify market exposures.  Below we offer a snapshot of two corporate bond landscapes: the U.S. corporate bond market and the Chinese corporate bond market, which has expanded rapidly in recent years.

Size
Tracked by the S&P U.S. Issued Investment Grade Corporate Bond Index and the S&P U.S. Issued High Yield Corporate Bond Index, the total size of the U.S. corporate bond market is around USD 4.8 trillion, which is approximately four times that of the Chinese corporate bond market. Within the Chinese corporate bond market, the offshore market, denoted by the S&P/DB ORBIT Credit Index, is relatively small compared with the onshore market, represented by the S&P China Corporate Bond Index.

Duration and Yield
Both onshore and offshore Chinese corporates demonstrated shorter durations and higher yields when compared with U.S. corporates. See Exhibit 1 for the comparison.

  • The S&P U.S. Issued Investment Grade Corporate Bond Index has the longest modified duration and lowest yield-to-maturity when compared with other indices, which reflects the underlying bonds’ quality premium, as well as the difference in the risk-free rates.
  • The S&P China Corporate Bond Index measures the performance of onshore corporate bonds and is composed of locally rated investment-grade, high-yield and unrated bonds. The index generally outperforms the S&P U.S. Issued High Yield Corporate Bond Index in terms of both yield-to-maturity and modified duration. Exhibit 2 lists the top five index constituents, which are all financial entities.
  • Given its short duration and mostly investment-grade-rated composition, the S&P/DB ORBIT Credit Index provides a compelling yield of 4.52%.

Comparison of the Corporate Bond Indices

Top Five Constituents in the SP China Coporate Bond Index

The posts on this blog are opinions, not advice. Please read our Disclaimers.

Corporate Bond Funds: Weighing performance scenarios

Contributor Image
Heather Mcardle

Director, Fixed Income Indices

S&P Dow Jones Indices

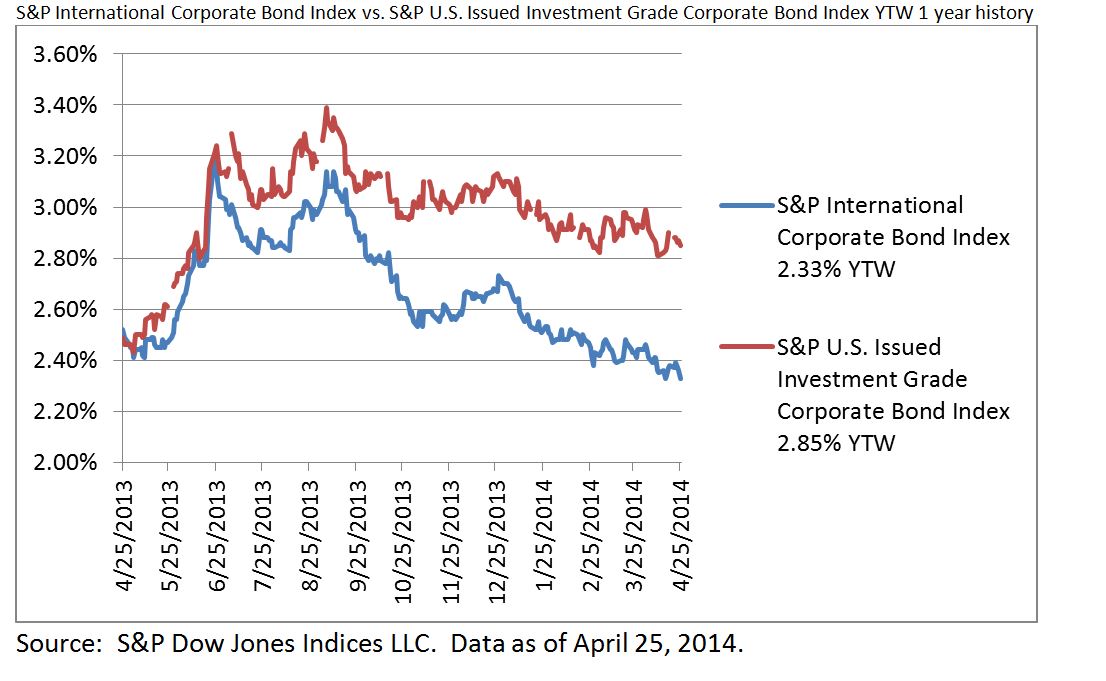
Investors are taught to diversify their portfolio by investing in several different asset classes with different risks and exposures.  In today’s low rate environment, the investment grade corporate bond market in the US and abroad offers a way to pick up additional yield and diversification, while maintaining a relatively low level of risk.  I weighed the performance scenarios of combining both U.S. and International Corporates in today’s economic environment. I compared two corporate bond indices: The S&P International Corporate Bond Index and the S&P US Issued Investment Grade Corporate Bond Index to determine what performance risks both face in their respective markets.  See below a comparison using at 1 year of Yield to Worst (YTW) history.

SP International Corporate Bond vs. SP U.S. Issued Investment Grade Corporate Bond Index YTW 1 Yr History

At first look, we see that the ytw for the US index is 2.85%, while the International index is 2.33%. An investor might choose the US corporate asset class on the lone basis that it is yielding 52bps higher. But to weigh future performance scenarios, while there are many different variables to consider, we will only focus on interest rates and f/x risk, and how those two factors affect bond prices.

The S&P US Issued Investment Grade Corporate Bond Index is comprised of US corporations issuing investment grade bonds in US dollars.  Rates in the US are currently at 0-.25%, all-time lows.  With the tapering of the government stimulus program and positive economic data like the shrinking of the unemployment rate, interest rates in the US are expected to go up.  A rise in interest rates will cause existing bond prices to go down.  This means the 52bp pick up in yield that one gets today would result in a lower total return later, as bond prices would decrease in a rising interest rate environment.

The S&P International Corporate Bond Index is comprised of non-U.S. investment grade corporate issuers and is calculated in US dollars.   Since this index comprises of bonds from the G10 currencies, with the euro having the largest weight, we will focus on Europe.   Europe has low rates of .25% currently. Inflation is very low at .5% and faces deflation risk. The European economy while growing, is growing at a very slow pace, currently .2% and unemployment rates are high. There seems to be no need to raise rates any time soon. If rates don’t go up in Europe then bond prices should remain relatively steady and will hedge any price depreciation in the US.  F/X rates will change the USD value for coupon and redemption payments. If rates in the US go up, the USD will strengthen.  The international fund would be worth less when converted to USD, even though their prices may stay relatively the same, as per the above scenario. Though, there is the possibility that the US economy isn’t growing fast enough for a significant rise in interest rates any time soon. If that’s the case, the USD would not necessarily go up and could weaken, causing the f/x risk in foreign markets to lessen, and possibly raise the value of those bonds in USD.   The USD could also weaken if it loses its safe haven premium.

In today’s market environment it is important to diversify and weigh risks accordingly.

The posts on this blog are opinions, not advice. Please read our Disclaimers.
Applying a Laddering Strategy to Preferred Portfolios in Canada

Contributor Image
Phillip Brzenk

Managing Director, Global Head of Multi-Asset Indices

S&P Dow Jones Indices

A laddered preferred portfolio uses the same concept as bond laddering, where a portfolio is constructed with instruments of staggering maturities so that a fixed portion of the portfolio matures each year. Rate-reset preferreds are used in a portfolio laddering strategy since they incorporate a reset date every five years. On the reset date, which can also be thought of as a maturity date, either the dividend is adjusted based on a spread above the current five-year government bond yield or the security is called for redemption.

The S&P/TSX Preferred Share Laddered Index is an example of a laddered preferred strategy. The portfolio is broken out into five term buckets based on the reset date calendar year, with each bucket given an equal weighting at rebalancing. This implies that a portion of the portfolio resets each year based on the current interest rate levels. At the beginning of each year, the buckets are changed so that the previously current year term bucket becomes the last term bucket, the year 1 term bucket becomes the current year term bucket, year 2 becomes year 1, and so on.

Capture1

Benefits and Risks of a Laddered Preferred Portfolio

The potential benefits of a laddered preferred portfolio largely relate to addressing interest rate risk. Perpetual preferreds have high sensitivity to interest rate changes since they have a fixed dividend payment and no set maturity date. Rate-reset preferreds typically exhibit less interest rate risk as the maximum time to the next reset date, or maturity, is five years. In fact, when looking at duration, it is estimated that rate-reset preferreds have durations between 2 and 3 years whereas perpetual preferreds have durations between 11 and 15 years[1]. In a portfolio context, the laddering strategy helps dampen negative effects of interest rate changes, while still offering the opportunity to participate in increased yields. If interest rates are low in a given year, only a portion of the portfolio will be reset to the lower yields. Conversely, the portfolio can benefit from increased interest rates, as part of the portfolio would reset to higher yields.

Two risks related to rate-reset preferreds involve call risk and changes in the regulatory landscape. Call risk may increase in low interest rate environments; when interest rates are low, credit spreads generally decrease between risk-free assets such as government bonds and risky assets such as preferreds. A company may be able to reduce interest expense by calling an outstanding preferred share class and issuing a new share class at a lower spread above the benchmark yield. Changes to the regulatory landscape also pose a threat to rate-reset preferreds. Under Basel III regulations, most preferreds including rate-resets will no longer be considered part of Tier 1 Capital from 2013 onward. This particularly affects financial institutions, as they are required to hold a certain percentage of total capital in Tier 1 assets. To comply with the new regulations, financial institutions may shift from issuing preferreds to other assets still considered to be Tier 1 Capital.

For more on preferreds in Canada, read our recent paper, “Looking Under the Hood of Canadian Preferred Indices.”

[1] Source: National Bank Financial Product Review: BMO Laddered Preferred Share, Jan. 16, 2013.

The posts on this blog are opinions, not advice. Please read our Disclaimers.