Get Indexology® Blog updates via email.

In This List

Deflation, Debt and Disaster

Buybacks and the S&P 500® EPS

Examining Emerging Market FX Contagion: It was all about Relative Risk-adjusted Performance

How do you know if an ETF is truly passive? A formulaic approach to ETF identification

War Risk

Deflation, Debt and Disaster

Contributor Image
David Blitzer

Former Managing Director and Chairman of the Index Committee

S&P Dow Jones Indices

Central Banks persist in fighting inflation. The Fed is tapering and talking about tighter money. The European Central Bank won’t cut interest rates. Only in Japan, where the Prime Minister is pushing the Bank of Japan is there a hint of a different approach.

Inflation rates in most developed markets are below central bank targets of 2%.   In the US the Personal Consumption Expenditures deflator – the Fed’s preferred measure – puts inflation at 0.9% over the four quarters of 2013.  The Eurozone consumer price index is a touch lower at 0.8% for the year ended in February.  Japan is the surprise leader with consumer prices up 1.1% after spending 2-1/2 years in negative territory.  All this raises two questions: what is so bad about deflation and why aren’t central banks doing something?

Deflation is falling prices – not just gasoline at $4 a gallon or the cost of health insurance – almost every price falls.  Deflation leads to stagnant economies and depression.  The problem is the prices that don’t fall.  In most economies wages and salaries rarely adjust downward.  Whether by convention, union contracts or competition for workers, wages are sticky.  As prices fall, employers face rising real (inflation adjusted) labor costs. One reason why job growth is still weak five years after the recession and many new jobs offer very low wages is that with inflation almost zero, the relative cost of labor is higher than it used to be.   The second problem is debt.  With deflation  the real value of debt rises, paying off debt becomes harder and defaults multiply.   The housing crisis was a limited example – home prices fell, incomes were stagnant and mortgage defaults rose. When the amount of money and credit in the economy collapse, prices and economic activity collapse.  That was the fall of 2008.  Despite the Fed’s timely response to pump  money and credit into the economy, we are still on the edge of deflation today.

Central banks could be more aggressive about deflation, but are more concerned with far distant future inflation.  Economic policy is, hopefully, based on good economic analysis; it is also based on primal fears and (re)fighting the last war. The first hand history of monetary policy in the US that economists and bankers can personally recall goes like this: 1970s saw rampant double digit inflation, Paul Volcker saved the economy and the Fed by ending inflation with a deep recession, setting the stage for two decades of economic growth and all was fine until home price inflation spooked the Fed and led to the financial crisis. The last war was the end of inflation in 1979-82.  Forgetting that lesson would a terrible thing.

In Europe the primal fear is Germany’s hyperinflation in the 1920s lead to Depression and the Second World War. For sixty years Europe was committed to preventing another inflation – either successfully in Germany or with frustration in other countries. This is why the Bundesbank, Germany’s pre-euro central bank, is held up as the model for the current European Central Bank.

Muddling along on the edge of deflation leaves the economy with more risk of collapse and too little growth.  The answer is not for the Fed to stop tapering and introduce QE4.  A better approach is fiscal policy – both spending and tax reform. The economy can afford some fiscal stimulus, especially to rebuild basic infrastructure like roads, bridges and airports.

The posts on this blog are opinions, not advice. Please read our Disclaimers.

Buybacks and the S&P 500® EPS

Contributor Image
Howard Silverblatt

Senior Index Analyst, Product Management

S&P Dow Jones Indices

Buybacks do not increase S&P 500 Index earnings-per-share (EPS), the Dow is a different story. On an issue level, share count reduction (SCR) increases EPS, therefore reducing the P/E and making stocks appear more ‘attractive’. SCR is typically accomplished via buybacks, with the vital statistic being not just how many shares you buy, but how many shares you issue.  In the most recent Q4 2013 period we saw companies spend 30.5% more than they spent in Q4 2012, though they purchased about the same number of shares.  The reason is (in case you didn’t notice), that prices have gone up, with the S&P 500 up 29.6% in 2013, and the average Q4 2013 price up 24.7% over Q4 2012.

Many companies, however, appear to have issued fewer sharers, and as a result have reduced their common share count. The result is that on an issue level it is not difficult to find issues with higher EPS growth than net income (USD) growth.  A quick search found that over 100 issues in the S&P 500 had EPS growth for 2013, which was at least 15% higher than the aggregate net income.  The result for those issues, were higher EPS and a lower P/E. On an index level, however, the situation is different.  The S&P index weighting methodology adjusts for shares, so buybacks are reflected in the calculations.  Specifically, the index reweights for major share changes on an event-driven basis, and each quarter, regardless of the change amount, it reweights the entire index membership. The actual index EPS calculation determines the index earnings for each issue in USD, based on the specific issues’ index shares, index float, and EPS. The calculation negates most of the share count change, and reduces the impact on EPS.

The situation, however, is the opposite for the Dow Jones Industrial 30.  The Dow methodology uses per share data items. So if a company reduces its shares, with the impact being a 10% increase in earnings (as an example) with a corresponding 5% increase in net income, the Dow’s EPS will show the increase in EPS.  Again, the impact would be mostly negated in the S&P 500. This is not to say that buybacks don’t impact stock performance, and therefore the stock level of the indices (and price is in P/E).  It is only to say that the direct impact on the S&P 500 EPS is limited, even as examples on an issue level are becoming easier to find.

DISCLAIMER
The analyses and projections discussed within are impersonal and are not tailored to the needs of any person, entity or group of persons.  Nothing presented herein is intended to, or should be interpreted as investment advice or as a recommendation by Standard & Poor’s or its affiliates to buy, sell, or hold any security.  This document does not constitute an offer of services in jurisdictions where Standard & Poor’s or its affiliates do not have the necessary licenses. Closing prices for S&P US benchmark indices are calculated by S&P Dow Jones Indices based on the closing price of the individual constituents of the Index as set by their primary exchange (i.e., NYSE, NASDAQ, NYSE AMEX).  Closing prices are received by S&P Dow Jones Indices from one of its vendors and verified by comparing them with prices from an alternative vendor. The vendors receive the closing price from the primary exchanges.  Real-time intraday prices are calculated similarly without a second verification.   It is not possible to invest directly in an index.  Exposure to an asset class is available through investable instruments based on an index.  Standard & Poor’s and its affiliates do not sponsor, endorse, sell or promote any investment fund or other vehicle that is offered by third parties and that seeks to provide an investment return based on the returns of any S&P Index.  There is no assurance that investment products based on the index will accurately track index performance or provide positive investment returns.  Neither S&P, any of its affiliates, or Howard Silverblatt guarantee the accuracy, completeness, timeliness or availability of any of the content provided herein, and none of these parties are responsible for any errors or omissions, regardless of the cause, for the results obtained from the use of the content.  All content is provided on an “as is” basis, and all parties disclaim any express or implied warranties associated with this information.  The notes and topics discussed herein are intended to quickly inform and are only provided upon request.  If you no longer wish to receive this information or if you feel that the information does not suit your needs, please send an email to Howard.silverblatt@spdji.com  and you will be removed from the distribution list.  A decision to invest in any such investment fund or other vehicle should not be made in reliance on any of the statements set forth in this document.  Standard & Poor’s receives compensation in connection with licensing its indices to third parties.  Any returns or performance provided within are for illustrative purposes only and do not demonstrate actual performance.  Past performance is not a guarantee of future investment results.  STANDARD & POOR’S, S&P, and S&P Dow Jones Indices are registered trademarks of Standard & Poor’s Financial Services LLC.

The posts on this blog are opinions, not advice. Please read our Disclaimers.

Examining Emerging Market FX Contagion: It was all about Relative Risk-adjusted Performance

Contributor Image
Bluford Putnam

Managing Director and Chief Economist

CME Group

A large number of emerging markets currencies declined en masse during the period from 30 April 2013 through 31 January 2014, with many observers applying the moniker of contagion.  Over the whole period many emerging market currencies were clustered in the range of losing between 9% and 22% of their value against the US dollar, with a few remaining stable, and some losing much more.

Our research argues that the emerging market contagion was driven by asset allocation shifts.  That is, expectations for relative risk-adjusted returns went dramatically against the emerging markets, and the Fed’s QE tapering had nothing to do with the FX activity.

Starting with risks in the political arena from the spring of 2013 onward, developments went against emerging market.   The Syrian Civil War was complicated by the nerve gas attacks and related US-Russian diplomacy.  There were demonstrations in the plazas of Turkey over development plans as well as a scandal reaching high into the Government.  Middle class residents were taking to the streets of Brazil to demand improved government services, even as the Government was spending generously on the infrastructure for the upcoming World Cup in 2014 and Olympic Games in 2016.  In Thailand, political unrest was threatening the electoral process.  India’s election campaign was heating up, with the possibility of a major change in political power.  Argentina experienced significant inflation, a currency devaluation and overall political confusion.  Ukrainian political tensions became violent.  Some of these tensions eased while others gained momentum over the year, but they all combined to create the impression that the riskiness in many emerging market countries was rising, and that spillover effects in various regions were not only possible, but likely.

From a performance perspective, the interesting development was in the US.  US equities rallied almost 30% in 2013 even as the US 10-Year Treasury yield went from less than 1.7% at the end of April 2013 to a new range, 2.7% to 3.0%, a full 100 basis points higher than before the “Taper Talk”.  The ability of US equities in 2013 effectively to ignore the coming policy change at the Fed to taper QE while US bonds were selling-off aggressively strongly suggests to us that QE was not responsible for the emerging market contagion.

The relative equity out-performance of the US was a two-way street and had at least a part of its roots in the deceleration of economic growth in many emerging market countries.  For example, economic growth in the four largest emerging market countries of Brazil, Russia, India, and China has been slowing with weighted average real GDP growth of 8.2% in 2010 declining to an estimated 5.5% in 2013 and a forecasted 5.1% for 2014.  (See “Decelerating BRICs Face Structural Challenges”, by Samantha Azzarello, December 9th 2013, http://www.cmegroup.com/education/featured-reports/decelerating-brics-face-structural-challenges.html).  The growth slowdown was accompanies by equity declines in many countries, with the MSCI Emerging Market Index losing 5% of its value over 2013.

The juxtaposition of a powerful rally in US equities set against decelerating economic growth and rising political risks in many emerging market countries, we would argue, provided the foundation and incentives for many global asset allocators, such as pensions, endowments, sovereign wealth funds, etc., to shift their asset allocation policies in the direction of US equities and other mature industrial markets, and away from emerging market countries.  This asset allocation shift hit both emerging market equities and currencies.  We are definitely not in the camp that thinks the Fed’s QE tapering debate and decision was a primary cause of the contagion.

S&P Dow Jones Indices is an independent third party provider of investable indices.  We do not sponsor, endorse, sell or promote any investment fund or other vehicle that is offered by third parties. The views and opinions of any third party contributor are his/her own and may not necessarily represent the views or opinions of S&P Dow Jones Indices or any of its affiliates.

The posts on this blog are opinions, not advice. Please read our Disclaimers.

How do you know if an ETF is truly passive? A formulaic approach to ETF identification

Contributor Image
Michael Mell

Global Head of Custom Indices

S&P Dow Jones Indices

The acronym “ETF” was once a reliable term to identify exchange traded funds using passive investment strategies, specifically those tracking transparent, rules based independently calculated indices.  “Today, the ETF acronym is being used broadly by the fund industry and media outlets to include non-fund product structures and active management strategies”[1].   Furthermore “active ETFs stand out in 2014 launches”[2]. Thus an “ETF” is no longer a guaranteed wrapper to access the benefits of passive investing.  This matters because “once management fees are factored in, the average actively managed fund loses to passive, lower-fee mutual funds and exchange-traded funds that track broad indexes”[3].

Distinguishing active ETFs from passive ETFs is necessary and should be easy. One does not track an index and the other does.  However that approach does not work anymore.  In the past all index tracking ETFs (including firms who self-indexed) had to disclose the index methodology, holdings and have the index independently calculated.   Today an index tracking ETF can be launched devoid of the full transparency fundamental to passive indexing.

“Unlike prior exemptive orders governing the operation of self-indexing ETFs, the Orders do not attempt to address potential conflicts of interest among the ETF, its investment adviser, and the affiliated index provider by requiring, among other things, public disclosure of the underlying index methodology, the use of a third-party index calculation agent, or formal “firewall” procedures. [4]

Such opaqueness is a feature of active strategies, not passive indexing.  Full transparency has been a key input to passive index investing for decades. Without knowing how the index works and what it holds an ETF is not truly passive, it’s something else.   Moreover when the underlying index is not calculated independently, the possibility for manipulation is arguably increased.  A formulaic approach is therefore needed to identify true passive ETFs and flag active ETFs.

Passive ETF = IT + TI + IC

where:
IT = Index Tracking
TI = Transparent Index
IC = Independently Calculated

Active ETF = NIT

where:
NIT = Not index tracking

Using these formulas it will become clear which investment philosophy is imbedded into an ETF, moreover it culls out the category of index tracking ETFs that are not independently calculated and withhold full disclosure of their methodology.


[1] Rick Ferri, ETF Does Not Mean Index Fund, http://www.rickferri.com/blog/investments/etf-does-not-mean-index-fund/
[2] Cynthia Murphy http://www.etf.com/sections/features/21157-active-etfs-stand-out-in-2014-launches.html
[3] Joe Light, The Myth of a Stock-Picker’s Market, http://online.wsj.com/news/articles/SB10001424052702304856504579338800864733042
[4] Morgan Lewis, Investment Management Lawflash, http://www.morganlewis.com/pubs/IM_LF_SECIssuesNewReliefSelfIndexingETFs_17july13.pdf

The posts on this blog are opinions, not advice. Please read our Disclaimers.

War Risk

Contributor Image
David Blitzer

Former Managing Director and Chairman of the Index Committee

S&P Dow Jones Indices

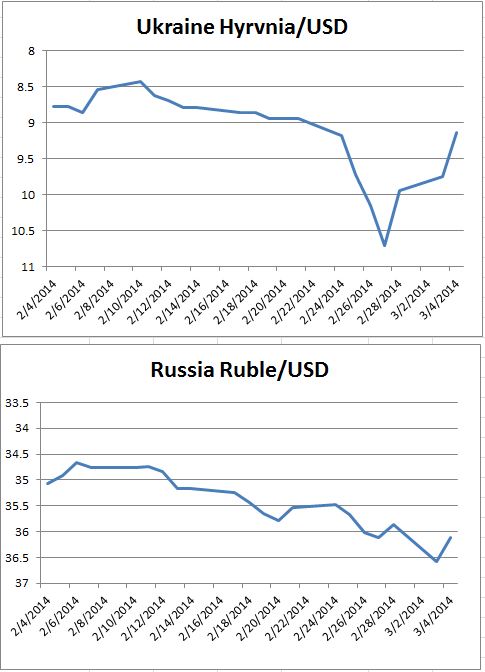
Russia and the Ukraine are dominating trading around the world since last Friday. The charts show the losses and rebound in the stock markets and currencies in the Ukraine and Russia.  The bounce back reflects both a seemingly more moderate comment from Russian President Putin on Tuesday morning as well as the markets pausing after a plunge.

At times the political risks far out-weigh any economic concerns. Moreover, the reaction to Russian troops in the Crimea wasn’t limited to markets in Kiev or Moscow. The US stock market dropped and global oil prices rose. One of the largest jumps was wheat. Looking forward, if the dust settles and the Ukraine remains an independent nation, the stock markets and the currencies are likely to recover.  The turn will come once there is good reason to believe the political situation will return to its pre-crisis position – so there may be a buying opportunity.  However, there are several possible negative scenarios.  The crisis could become a stalemate in which both the Ukrainian and Russian stock markets would probably drift downward, currencies would not rebound and both countries would face recessions.  Any economic sanctions imposed by the US or the EU would hasten both recession and further currency weakness in Russia while having only limited benefits for the Ukraine.   If Russia were to assume effective control of the country, the disappearance of Ukraine’s stock market cannot be ruled out.  In some crises markets collapse. In others, including in wars, markets vanish.

source: Bloomberg data, chart S&P DJI
source:Bloomberg data, charts S&P DJI


The posts on this blog are opinions, not advice. Please read our Disclaimers.