Last Friday’s employment report for January was greeted with groans and sighs. The weak payrolls number in December was revised upward by only a thousand jobs and the January figure, at 113,000, was a big disappointment. While the unemployment rate did drop to 6.6% from 6.7%, the change was as small as could be reported and most Wall Street analysts believe that the payrolls number is a far more reliable number anyway. Neither payrolls nor the unemployment rate should be ignored – they tell different, though hopefully consistent, stories about different elements of the economy. As weak as the payrolls were, the unemployment rate and the rest of the data from the household survey offer some encouragement.
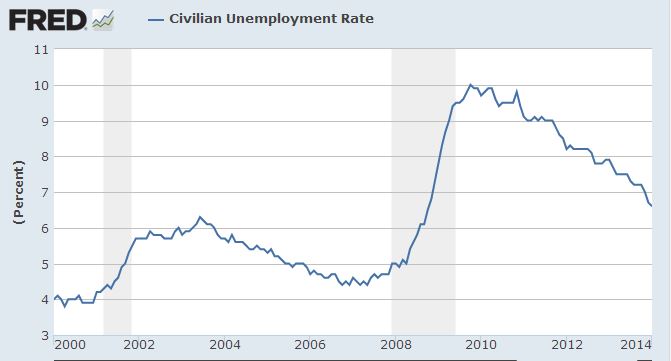
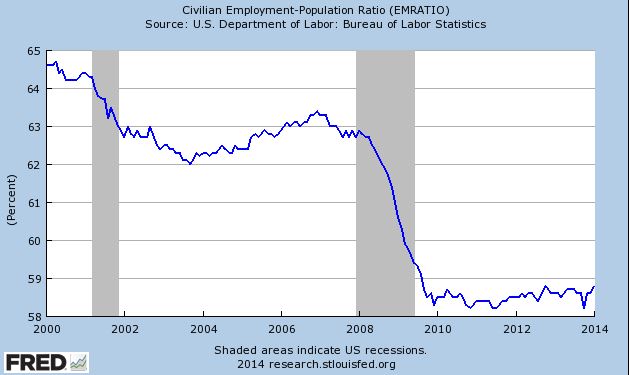
First, the unemployment rate is falling consistently so the small drop of 0.1 percentage points was more likely a real change than random noise. (see first chart) Second, other data in the household survey are also showing some continuing improvements. As noted on the Wall Street Journal’s economics blog, the employment-population ratio – the percentage of people working – is creeping up since last fall and reached a new high since the recession ended in 2009. Many complain the unemployment rate is biased because when people drop out of the labor force, they are not counted as unemployed. The employment-population ratio counts people even if they drop out. The gains are still small, but appear to be going in the right direction. (see second chart) On top of these measures, other numbers looked better as well. Labor force participation increased and the number of people working part time because they couldn’t find full time jobs went down. Whether the good news continues remains to be seen, but the trends are encouraging.
Some worry that the Fed may accelerate its tapering or even raise interest rates if the unemployment rate passes 6.5%. Not to worry. The Fed is not likely to move any time soon. The economy is still weak and inflation is too low, so we are likely to remain at the zero lower bound for awhile longer.
Data for charts are from the US Bureau of Labor Statistics via the St. Louis Federal Reserve Bank’s service, FRED. Data are monthly, January 2000 to January 2014.
The posts on this blog are opinions, not advice. Please read our Disclaimers.