Get Indexology® Blog updates via email.

In This List

You Take My “Breadth” Away

A Simple Hedge Strategy

Money Grows on THESE Trees

View from Down Under

Passive Risk Management

You Take My “Breadth” Away

Contributor Image
Howard Silverblatt

Senior Index Analyst, Product Management

S&P Dow Jones Indices

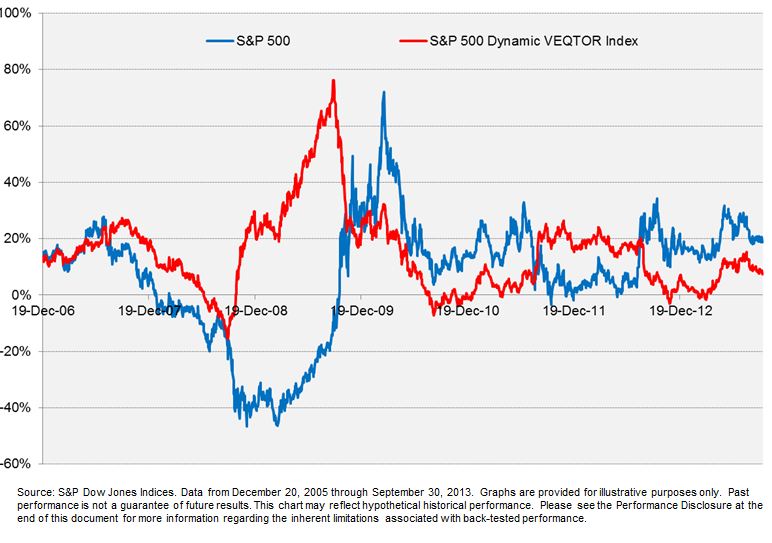
An overview of the market shows that breadth, the number of issues up compared to the number down, is running very strong this year.  Year-to-date (YTD), 451 of the S&P 500 issues are up (47 down), which on an annual basis is the best since 458 issues increased in 2003.  The 2003 number is also a record high from 1980, when my data series starts.  The number is significant since it shows the depth of the recovery.  In the late 1990s, the market aggregates became dominated by technology, which grew on ‘faith’ and ‘hits’, as compared to sales and cash-flow.  In 1998, the market returned 26.67%, yet only 57.8% of the issues were up, and in 1999, the market grew 19.53%, but less than half, 48.2% of the issues, were up.  For the 2013 YTD, 90.2% of the issues are higher, with the market aggregate up 23.39%; 270 issues are above that aggregate, with 140 issues up at least 40%.  Surely, a significant number of people are seeing large gains, and surely, many are not, since they remain out of the market.

At the beginning of this year, when we did not fall off the financial cliff, investors poured billions into the market (the 1/2/2013 opening of 2.54% remains the best day since the 2.98% opening on 12/20/2011) – partially in relief, but also partially because frustration grew over not getting any return for their money after being out of the market in 2012 (the market was up 13.41%; 16% with dividends in 2012).  Chasing returns is not a good reason to invest, but when enough do it, the short-term impacts are more buying and higher prices- which we may be getting close to if the market stays anywhere near its current level. (FYI – Friday set two new official highs, an intraday of 1759.82, and a close of 1759.77)

Please note that the statistical data is based on publicly available information, most of which is available in S&P products such as Capital IQ, Compustat Research Insight and S&P Index Alert.  Analysis and projections are my own, and may differ from others within S&P/McGrawHill.  Nothing presented is intended to, or should be interpreted as, a buy/sell/hold recommendation.

My notes vary in topics, but are market related. The intent is to quickly inform. The assumption is that you don’t need a basic education, editorial or sales pitch, just specific facts and maybe some observations. If the information does not suit your needs, please e-mail me and I will take you off the list. Unless otherwise noted all data is for public dissemination, and may not be used for commercial purposes.  Finally, any incoming correspondence from you will be considered confidential unless you specify otherwise.    

DISCLAIMER
The analyses and projections discussed within are impersonal and are not tailored to the needs of any person, entity or group of persons.  Nothing presented herein is intended to, or should be interpreted as investment advice or as a recommendation by Standard & Poor’s or its affiliates to buy, sell, or hold any security.  This document does not constitute an offer of services in jurisdictions where Standard & Poor’s or its affiliates do not have the necessary licenses. Closing prices for S&P US benchmark indices are calculated by S&P Dow Jones Indices based on the closing price of the individual constituents of the Index as set by their primary exchange (i.e., NYSE, NASDAQ, NYSE AMEX).  Closing prices are received by S&P Dow Jones Indices from one of its vendors and verified by comparing them with prices from an alternative vendor. The vendors receive the closing price from the primary exchanges.  Real-time intraday prices are calculated similarly without a second verification.   It is not possible to invest directly in an index.  Exposure to an asset class is available through investable instruments based on an index.  Standard & Poor’s and its affiliates do not sponsor, endorse, sell or promote any investment fund or other vehicle that is offered by third parties and that seeks to provide an investment return based on the returns of any S&P Index.  There is no assurance that investment products based on the index will accurately track index performance or provide positive investment returns.  Neither S&P, any of its affiliates, or Howard Silverblatt guarantee the accuracy, completeness, timeliness or availability of any of the content provided herein, and none of these parties are responsible for any errors or omissions, regardless of the cause, for the results obtained from the use of the content.  All content is provided on an “as is” basis, and all parties disclaim any express or implied warranties associated with this information.  The notes and topics discussed herein are intended to quickly inform and are only provided upon request.  If you no longer wish to receive this information or if you feel that the information does not suit your needs, please send an email to Howard.silverblatt@spdji.com  and you will be removed from the distribution list.  A decision to invest in any such investment fund or other vehicle should not be made in reliance on any of the statements set forth in this document.  Standard & Poor’s receives compensation in connection with licensing its indices to third parties.  Any returns or performance provided within are for illustrative purposes only and do not demonstrate actual performance.  Past performance is not a guarantee of future investment results.  STANDARD & POOR’S, S&P, and S&P Dow Jones Indices are registered trademarks of Standard & Poor’s Financial Services LLC.


The posts on this blog are opinions, not advice. Please read our Disclaimers.

A Simple Hedge Strategy

Contributor Image
Craig Lazzara

Former Managing Director, Index Investment Strategy

S&P Dow Jones Indices

Alternative investments for high net worth investors are like the weather — everyone talks about it, but no one does anything about it.  In fairness, alternative investments — hedge funds, private equity, and the like — are often hard to access and complicated to explain.  But if they can deliver on their promise of uncorrelated returns — i.e., can serve as an effective hedge to an investor’s equity portfolio — then the game may well be worth the candle.

Not all alternative strategies are complicated or inaccessible.  The S&P Dynamic VEQTOR Index, e.g., exploits the well-known inverse correlation between the equity market and volatility.  When volatility spikes, in other words, the equity market typically plunges, whereas when volatility is declining, equities typically do well.  So an index which is long both volatility and equities has the potential to deliver a relatively smooth pattern of returns compared to either asset class in isolation.  That, it a nutshell, is what VEQTOR aims to do.

And successfully so, as the graph below demonstrates.  We’ve graphed trailing 252-day (i.e. approximately one year) returns for both the S&P 500 and the S&P Dynamic VEQTOR Index.  When the equity market was at its worst (e.g. during the 2008 financial crisis), VEQTOR did extremely well, since that’s exactly when its long volatility position was paying off.  During more normal equity environments, VEQTOR tends to lag.

VEQTOR vs S&P 500

One of the remarkable things about VEQTOR is that it’s relatively uncommon for it to show a loss on a trailing 252-day basis.  (Notice how the red line in the graph is typically above zero.)  We can measure this effect by asking how often VEQTOR lost money:

VEQTOR Probability of Loss

The chart tells us that, of all the 252-day lookback periods in our data, the S&P 500 lost more than 20% 12.7% of the time.  VEQTOR never lost that much.  The other rows have an analogous interpretation.  Most notably, VEQTOR lost money only 11.2% of the time — substantially less than the S&P 500.

This pattern of returns — limited downside with negative correlation to the equity market — is exactly the pattern of returns that makes alternatives appealing .  VEQTOR demonstrates that such patterns can be both attractive and accessible.

The posts on this blog are opinions, not advice. Please read our Disclaimers.

Money Grows on THESE Trees

Contributor Image
Jodie Gunzberg

Former Managing Director, Head of U.S. Equities

S&P Dow Jones Indices

My parents used to tell me that money doesn’t grow on trees, but they didn’t know about the Eucalyptus trees in Australia like the one shown below.

Money Tree

The science journal, Nature Communications, reported Eucalyptus trees in western and southern Australia absorb gold through their roots and transport it up all the way through their leaves.  The findings suggested the trees could tap into gold deposits up to 115 feet deep. While the amount of gold found is relatively small, these trees may help miners more efficiently locate gold deposits, which over vast lands, may otherwise be a costly process.

Over the past decade, as gold prices rose, gold companies spent heavily on new capital projects and exploration as shown in the chart below.

Gold Production Cost

However, that level of spending may not be sustainable since the price of gold has fallen 28.6% from its peak price on August 22, 2011, as measured by the S&P GSCI Gold.   


Source: S&P Dow Jones Indices. Data from Jan 1978 to Oct 24, 2013. Past performance is not an indication of future results. This chart reflects hypothetical historical performance. Please see the Performance Disclosure at the end of this document for more information regarding the inherent limitations associated with backtested performance
Source: S&P Dow Jones Indices. Data from Jan 1978 to Oct 24, 2013. Past performance is not an indication of future results. This chart reflects hypothetical historical performance. Please see the Performance Disclosure at the end of this document for more information regarding the inherent limitations associated with backtested performance.

Cutting capital costs may not be the best solution though, since that may result in a decline in production, and consequently drive up the cost of producing each ounce of gold. The Citi report containing the above production cost chart also showed that despite the tenfold rise in capex over the past 12 years, production fell 5%, with unit costs rising 16% annually.

While it is possible the Eucalyptus trees could help reduce capital expenditures, gold prices continue to be more strongly influenced by the quantitative easing.  Yesterday on Oct 24, 2013, S&P GSCI Gold reached a new high of 786.2, since Sept 19 when the Fed announced it would not taper its bond buying.  If the U.S. economic data keeps missing expectations, then the dollar may weaken and the Fed may continue its stimulus, supporting gold even further.


The posts on this blog are opinions, not advice. Please read our Disclaimers.

View from Down Under

Contributor Image
David Blitzer

Former Managing Director and Chairman of the Index Committee

S&P Dow Jones Indices

The world view in Sydney is quite different than in New York.  No one is worried or disgusted with the US government’s recent shutdown or debt ceiling follies – in fact only a few even comment about it. Likewise much of the anxiety American analysts suffer about the unemployment rate, weak GDP growth and “policy uncertainty” is completely absent. A glance at some of the figures can explain some of the differences. When the Great Recession rolled through the US and Europe, little happened in Australia. At the worst moment real GDP was up, not down, by one percent from 2008 to 2009; the unemployment rate is less than the US, and inflation is comparable to the US.   The stock market is up about 15% year to date, a bit behind the 22% for the S&P 500.  Maybe this is a reminder to Americans to spend less time worrying about the ineffectual US government.

All this shouldn’t suggest that down under no one ever thinks about the US. The newly nominated Fed chair is a topic of interest.  As in America, people forget that the last three Fed chairman (Volcker, Greenspan and Bernanke) all demonstrated that the Fed can and will act when necessary.  Questions hint that Janet Yellin could find little room for maneuver or be a lame duck from the start – not likely to happen.  No one knows more about how the Fed work and how to make work than Janet Yellin.  The other topic of interest is Obamacare – lots of questions and skepticism crops up in the news media.

China is a topic of interest all over, including in Australia.  Unlike the US worries about a future world power, here the question is whether China’s growth and its appetite for Australia’s natural resources will fade.  Recent numbers suggest there is not too much to worry about.

In any event, it is back to the US and the old worries next week.

The posts on this blog are opinions, not advice. Please read our Disclaimers.

Passive Risk Management

Contributor Image
Tim Edwards

Managing Director, Index Investment Strategy

S&P Dow Jones Indices

In major cities at this time of year, an army of street vendors bristling with umbrellas await their chance to emerge in entrepreneurial fervour, providing tourists and commuters alike with immediate respite from unanticipated rain. It’s a viable business strategy: the chaotic nature of weather means that occasional rainfall remains practically impossible to predict*, hence our common tendency to rely on an adaptive strategy. Demand and cost rises with tempestuous environments, while the inconvenience of preparing for the worst is a frustrating drag in sunnier times.

 So does the same strategy of purchasing protection “as needed” work in the stock market? And does it cost more to do so? Stretching the analogy somewhat, we’ll look at three simple strategies to mitigate equity risk, and explain a little more behind the three indices shown below, each of which incorporates a different way to hedge an investment in the S&P 500® Index dynamically:

Passive RM 1

Source: S&P Dow Jones Indices. Total returns shown for the five year period to October 18th, 2013. Charts and graphs are provided for illustrative purposes. Past performance is no guarantee of future results.

1)      Move to sunnier climates: permanently avoid more risky stocks

The “low volatility effect,” sometimes called the low volatility “anomaly,” refers to the tendency – manifest across a wide range of markets – for stocks with low volatility to outperform their peers, especially in terms of risk-adjusted returns. While academics continue debate the underlying dynamics – a behavioural explanation supposes that speculatively minded investors will gladly overpay for a potentially oversized return** – investors can capture this effect through indices that underweight or remove stocks with higher volatility. The S&P 500 Low Volatility Index removes 80% of the most volatile stocks from the index and weights to the remainder inversely proportional to their historical volatility.

2)      Go back inside when it’s wet: exploit regimes in volatility

Volatility tends to persist: the level of the volatility today can be a guide to volatility tomorrow. If markets are currently choppy, it therefore may make sense to de-risk going forward. Systematic “risk control” indices realize this approach by explicitly targeting a prespecified risk level, dynamically allocating between equity and cash (in more volatile periods) in order to maintain the target. As well as potentially providing better performance, indices with such controls have gained widespread traction because of the reduced costs of protection – significantly cheaper put options in particular.

3)      If everyone else is preparing for a storm, maybe you should too

The so-called “fear index”, VIX, reflects market expectations of future volatility. Surprisingly (perhaps), a high level of actual volatility shows a mild historical bias towards a subsequent positive return for VIX futures. Additionally, the VIX has also historically shown trending behaviour (if people are getting more worried, maybe you should too). Taken together, this suggests that a high and increasing VIX is a potentially useful signal.

Strategies that aim to capture trends or regimes typically show performance somewhat idiosyncratic to the specifics of their individual signal construction, but with nearly four years of live history the S&P VEQTOR Index provides a concrete example of the latter concept, using levels and trends in volatility to allocate between the 500® and short-term VIX futures.

Passive RM 2

Over the past five years, each of the three risk management strategies above resulted in an improved risk/return profile in comparison to the S&P 500®. And while we are duly assured that history is no guide to future performance, such results certainly support the view that dynamic risk management may be sensibly obtained without the costs of appointing an external active manager. Not dragging your golfing umbrella round in the sunshine, on the other hand, is likely to remain beyond the aegis of science. At least the street vendors will be glad of that.


* Even the much-admired UK Met Office only targets 70% accuracy for predictions over the next three hours.

** Anyone unconvinced might consider the (financially irrational) demand for lottery tickets.

The posts on this blog are opinions, not advice. Please read our Disclaimers.