Get Indexology® Blog updates via email.

In This List

Lower Gas Bill? Why Not?

Turn VIX into information you can use

Right Beta equals Right Alpha

The Hunt For Red October

Sukuk – Let’s Do the Profit Sharing!

Lower Gas Bill? Why Not?

Contributor Image
Jodie Gunzberg

Former Managing Director, Head of U.S. Equities

S&P Dow Jones Indices

As mentioned in my last post, logistics and technology are the two key factors in propelling commodities from local markets to global markets. The U.S. is now expected to be the biggest producer of natural gas in 2013, so what does that mean for the residents? Will gas bills be cheaper? Will there be a growth of U.S. natural gas into a global commodity?

The U.S. Energy Information Administration (EIA) showed the following graph in a recent report:

US Gas Producer 2013

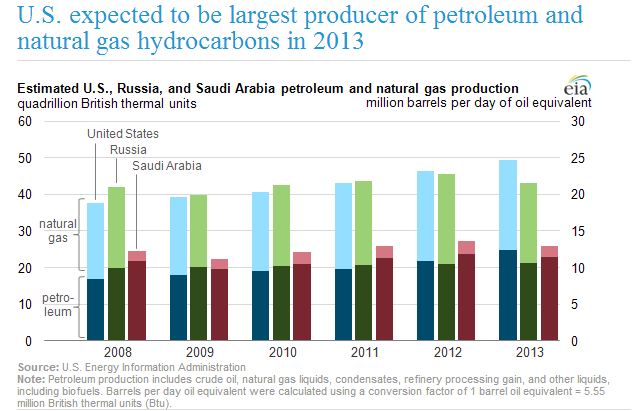
Although the U.S. natural gas production is set to surpass Russia and Saudi Arabia, natural gas is one of the most difficult and expensive commodities to store and transport. Below is a map that shows the production across the U.S. where the Northeast has had tremendous growth.

US Gas Map

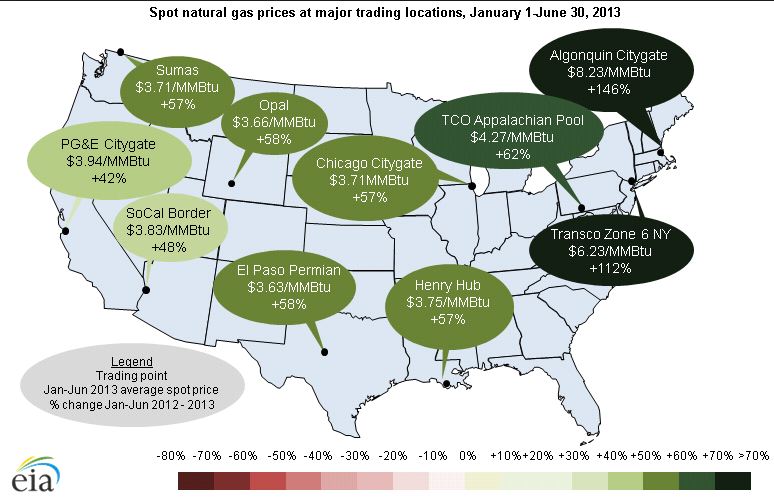
From these 10 major locations, the challenge is to store and transport the gas. One way to see this through indexing is to look at the negative roll yield by subtracting the price return index from the excess return version. Notice two things in the chart below are that there has not been a significant positive roll yield since Feb 2003 and that there is a recurring high seasonal cost around this time of year.

Source: S&P Dow Jones Indices. Data from Dec 2002 to Oct 20, 2013. Past performance is not an indication of future results. This chart reflects hypothetical historical performance. Please see the Performance Disclosure at the end of this document for more information regarding the inherent limitations associated with backtested performance
Source: S&P Dow Jones Indices. Data from Dec 2002 to Oct 21, 2013. Past performance is not an indication of future results. This chart reflects hypothetical historical performance. Please see the Performance Disclosure at the end of this document for more information regarding the inherent limitations associated with backtested performance.

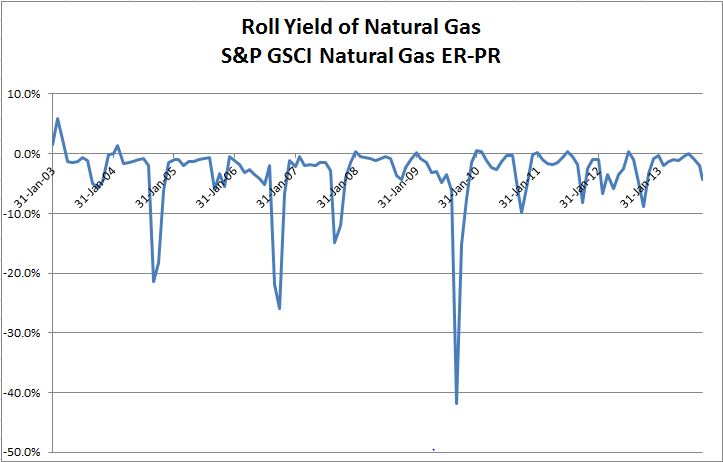
Also notice how high on average the roll costs are in Sept-Oct versus the rest of the year and that Oct 2013 has the lowest Oct roll cost since 2005.

Source: S&P Dow Jones Indices. Data from Dec 2002 to Oct 20, 2013. Past performance is not an indication of future results. This chart reflects hypothetical historical performance. Please see the Performance Disclosure at the end of this document for more information regarding the inherent limitations associated with backtested performance
Source: S&P Dow Jones Indices. Data from Dec 2002 to Oct 21, 2013. Past performance is not an indication of future results. This chart reflects hypothetical historical performance. Please see the Performance Disclosure at the end of this document for more information regarding the inherent limitations associated with backtested performance

With that, the S&P GSCI Spot Index Level is down to 61.7 from a starting point of 100 on Dec 31, 2002.

Source: S&P Dow Jones Indices. Data from Dec 2002 to Oct 21, 2013. Past performance is not an indication of future results. This chart reflects hypothetical historical performance. Please see the Performance Disclosure at the end of this document for more information regarding the inherent limitations associated with backtested performance

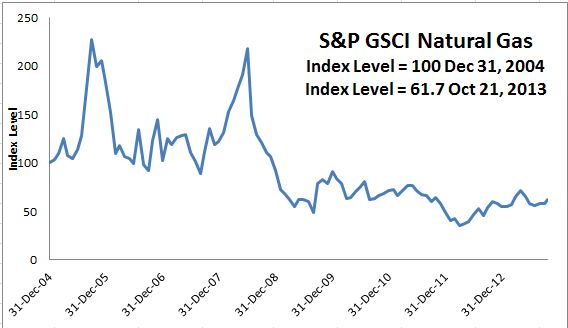
Which as a general measure of the market, falls in between the residential and wholesale prices shown below.

Nat Gas Res WS

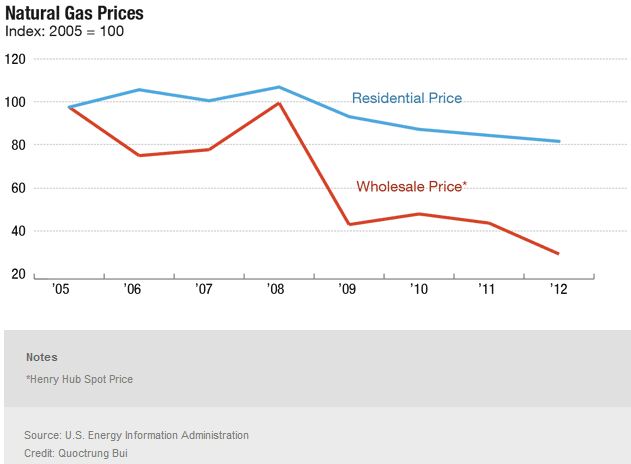
Why do the wholesalers get the cheaper price but consumer like you and me have to pay? As Quoctrung Bui points out in his article, a big chunk of our gas bill is the cost of building and maintaining pipes. Just the mechanism that Gary Morsches discussed in his interview. Those costs don’t go down when natural gas prices fall, so the prices consumers pay for gas haven’t fallen nearly as much as the wholesale price for gas.

Last, the question of whether U.S. natural gas can grow into a global commodity might depend on where the heaviest investment is spent. Many companies that produce goods out of natural gas are eagerly building facilities to take advantage of low prices, but that will cut into inventory and eventually drive prices up again if production can’t keep up with demand.  Also, there are a few countries with larger natural gas reserves than in the U.S. –

Nat Gas Reserves

and if they invest more heavily in exploration and production – or technology as Gary puts it, than in logistics (China announced $13 billion in planned spending for E&P), then the chance U.S. natural gas becomes global is less likely.  Earlier in the year there was news of a U.K. company signing a deal to bring U.S. natural gas to U.K. homes, which may help the U.S. natural gas globalization, but then the real question may be how long it will last.


The posts on this blog are opinions, not advice. Please read our Disclaimers.

Turn VIX into information you can use

Contributor Image
Reid Steadman

Former Managing Director, Global Head of ESG & Innovation

S&P Dow Jones Indices

Most people think of VIX as simply an index.  This makes sense — the “I” in VIX stands for that very word.  But VIX is more useful than your average index.  It could easily be grouped with economic indicators, like the unemployment percentage or new home sales.  Why?  Because the VIX level — not just the changes in that level — contains valuable information.  In this post I will show you how, with some high school math, you can extract this information and arm yourself with knowledge that will inform your investment decisions.

VIX is not your typical index
When an index provider starts calculating a new index, they will choose a starting point, a base level.  This can be any number —  100, 1000, or even a million.  Investors correctly don’t pay much attention to that.  It’s the percentage changes in this index, driven by the increases and decreases in value of the securities it comprises, which are of most value to the market.

In the case of VIX, movements up and down are important as well.  However, the actual VIX level means something too.  It communicates the 30-day implied volatility of the S&P 500.  In a previous post, I explained what this means.

But how can we arrive at the 30-day implied volatility?  How do we convert the current VIX level into this information?  This isn’t hard, but it does require some simple math.  Here are the two steps.

  1. Turn the VIX level into a percentage.  So, a VIX level of 15 equates 15%.  This is the annualized implied 30-day volatility for the S&P 500.
  2. Deannualize VIX to turn it back into its true monthly measure.  The formula for this is to divide the VIX level, as a percentage, by the square root of 12, the number of months in a year.

This table shows how VIX levels translate into 30-day implied volatility figures using this approach.


You may wonder why we would divide by the square root of 12.  My advice is to put this deep question aside and to concentrate on the basics.  For now, it is sufficient to know that you can back out the 30-day implied volatility from the VIX level with this simple formula.

Understanding what “volatility” is in the context of VIX
The implied 30-day volatility of the S&P 500 tells you the likely range of possible index levels the market “expects” in a month.  If the implied 30-day volatility is 4.3% — which equates a VIX level of 15 — then this means that the market expects the index to have a return that is within a range that spans 4.3% higher and 4.3% lower than the index level.*

We say “expects” because the market isn’t sure and is instead communicating what will probably happen.  You will remember from your basic statistics courses that when someone brings up probability, a bell curve soon follows.  This blog post is no exception.

Below is a normal distribution, the most common type of probability distribution that supposes that most data points will fall near the average.  On this type of curve, one standard deviation comprises about 68% of likely outcomes.  In our case, the data points in the bell curve are possible index levels the S&P 500 could arrive at 30 days from now.  The 30-day implied “volatility” that VIX conveys is one standard deviation in the bell curve, which is centered on the index level.


Putting this knowledge into practice
Now that you know the basics, let’s use them.  Assume that today, the S&P 500 level is 1710 and the VIX level is 18.  What additional information can you extract from these two data points?

As a first step, turn the VIX level into the 30-day implied volatility:

Turn VIX into a percentage: VIX = 18 = 18%

Then deannualize it:  18% / √12 = 5.20%

Second, apply this percentage to the index level:

1710 x 5.20% ≈ 89

Third, subtract and add this amount to the index level to tell you the range the market expects the S&P 500 to trade in 30 days from now, with a 68% confidence level:

1710 + 89 = 1799

1710 – 89 =  1621

The range between these numbers, 1621 to 1799, is where the market expects the S&P 500 to trade in 30 days, with a reasonably high level of confidence.  You may agree or disagree with this, but this is what the market believes, and this is a powerful starting point around which to build an investment strategy.

* Using the current index level is a helpful shortcut.  In reality, the probability curve is centered around the forward price of the index, which is the current index level adjusted for various payments the investor hypothetically might have received or lost, including interest, dividends, and income from stock lending.  Making these adjustments matters less if you are only looking ahead a short time and if interest rates and dividends are low.

The posts on this blog are opinions, not advice. Please read our Disclaimers.

Right Beta equals Right Alpha

Contributor Image
Anubhav Srivastava

Head - Product Development

Motilal Oswal Asset Management

In India, over the past few months, investors have seen their investments erode in value. All asset classes are highly correlated and a simple debt plus equity diversification does not help either with the returns or with lowering volatility. In this scenario, Index based investing as a part of larger asset allocation strategy is now beginning to gain ground among advisors and investment advisory platform alike.

Using index ETFs’ gives the advisors several advantages – the investment and holding is transparent, low cost and comes with the credibility of the Index owner / calculating agent. Furthermore, most indices come with built in RIC and UCITS compliance thereby ensuring optimal diversification within and reducing company specific risk.

In turbulent and for institutional investors looking at both temporary exposure as well as complex quantitative strategies, index investing is both more efficient from a risk perspective as well as significantly cheaper.

In India, with the advent of foreign index based investment avenues, Private Bankers as well as Independent Financial advisors have shown a keen interest in indices. These allocations form a part of return enhancement as well as risk mitigation strategies for bespoke portfolios.

Some challenges do remain and these are primarily regulatory. Currently Insurance companies and pension funds have significant restrictions placed on them for index exposures. However, these are expected to be resolved in the near future.

S&P Dow Jones Indices is an independent third party provider of investable indices.  We do not sponsor, endorse, sell or promote any investment fund or other vehicle that is offered by third parties. The views and opinions of any third party contributor are his/her own and may not necessarily represent the views or opinions of S&P Dow Jones Indices or any of its affiliates.

The posts on this blog are opinions, not advice. Please read our Disclaimers.

The Hunt For Red October

Contributor Image
Kevin Horan

Former Director, Fixed Income Indices

S&P Dow Jones Indices

In the iconic film The Hunt for Red October, released in 1990, the cold war standoff between the U.S. and the Soviet Union is taken new to heights. Based on a novel of the same title written by the recently deceased author Tom Clancy, a CIA analyst finds himself in over his head in the middle of an international crisis. Packed with too many stars to mention, Jack Ryan, played by Alec Baldwin, finds himself on the nuclear submarine U.S.S. Dallas trying to convince its Captain, Bart Mancuso, that a Soviet submarine they are chasing is actually looking to defect, not to attack the U.S. with nuclear weapons as the Soviets claim. As the two submarines sail towards each other, Captain Mancuso says to Ryan, “The hard part about playing chicken is knowin’ when to flinch.”

Although not quite as theatrical or as thrilling as in the movie, the U.S. economy is facing a similarly tense situation today. Though the political haranguing over the debt limit has been quite public, its effect on investments has, so far, remained relatively unseen. Equity markets, as measured by the S&P 500 Index, have been steady, with average price actions that would not garner significant attention. The largest decline this month was a 20.6 point drop on Oct. 8, which was followed by four days of gains totaling 55 points. As for bonds, the S&P/BGCantor Current 10-Year U.S. Treasury Index, which measures the performance of the on-the-run 10-year Treasury, is down -0.53% month-to-date while its yield-to-worst has widened by 0.07 basis points (bps). Investment-grade corporate bonds, as measured by the S&P U.S. Issued Investment Grade Corporate Bond Index, are up 0.09% for the month, while lower quality high-yield bonds represented by the S&P U.S. Issued High Yield Corporate Bond Index are up 0.7% on the month.

So far everything seems like business as usual, with all eyes watching Washington to see if something more significant develops. If there have been any worrisome waves from this round of partisan bickering, they would be in the U.S. Treasury bill market. The yield-to-worst on the S&P/BGCantor U.S. Treasury Bill Index has widened by 13 bps. This is a yield that, up until the end of September, has averaged 6 bps for the year. The maximum change in daily yield for the same time period had been just 3 bps. Funding for the U.S. government is getting more expensive and the clock is ticking. The Treasury’s October 17th, deadline is quickly approaching and, like the plot of Tom Clancy’s novel, the ramifications of failure will have a great impact both politically and economically.

The posts on this blog are opinions, not advice. Please read our Disclaimers.

Sukuk – Let’s Do the Profit Sharing!

Contributor Image
Michele Leung

Former Director, Fixed Income Indices

S&P Dow Jones Indices

It all started with the Quran, the religious book of Islam, which guides all aspects of Muslim’s life. It is one of the fundamental sources of the Islamic (Shariah) law. The Shariah law has strict rules on finance; it forbids both interest “Riba” and uncertainty “Ghara”. It also prohibits a number of practices, such as any form of gambling “Qimar” and business that are related to alcohol, tobacco and immoral entertainment “Haram”.

Since interest-bearing bonds are not allowed, the emergence of Sukuk provided a new source of financing in this relatively restrictive environment. Sukuk are regarded as a highly innovative financial instrument in Islamic finance; it also facilitates rapid infrastructure funding and capital market development in the regions.

According to Auditing and Accounting Organization of Islamic Financial Institutions (AAOIFI), Sukuk are defined as “the certificates of equal value representing undivided shares in ownership of tangible assets, usufruct and services or in ownership of the asset of a particular project or special investment activity”. Unlike conventional bonds, Sukuk are based on a variety of contracts to create financial obligations and the returns to investors are considered as profit sharing, not interest!

Sukuk are becoming a popular investment asset class in both Islamic and non-Islamic communities. In addition to attractive yields, Sukuk are also perceived as higher quality assets since the Sukuk holders are in actual ownership of the tangible underlying assets. The primary market is active, for example, we had Abu Dhabi Investment Council and Republic of Turkey tapped onto the market in the past few weeks.

The Dow Jones Sukuk Total Return Index was created as an independent benchmark for investors seeking to track the performance and characteristics of U.S. dollar denominated and investment grade Sukuk issued in the global markets. The index rose 42% since it was first valued on September 30, 2005. On 10/14/2013, the yield to maturity was 3.10% with a duration of 4.35. The index is is currently tracking $33 billion of assets.

So how are the constituents of the Sukuk indices screened for Shariah compliance? First they must be certified as Sukuk by a globally recognized Shariah Supervisory Board. Second, they must comply with AAOIFI standards for tradable Sukuk. Lastly, the underlying assets must comply with Shariah principles, such the primary business are not engaged in any of the so-called prohibited industries.

As the Sukuk market evolves both in Asia and the Middle East, new Sukuk indices continue to be developed to meet growing investor demand for additional transparency into those markets. For example, the S&P MENA Sukuk Index was recently launched to specifically track the performance of Sukuk in the Middle East and North Africa (MENA) markets. These indices are designed to be broad benchmarks for both funds and ETFs.

The success of the continued Sukuk market expansion will rely on the depth of the secondary market. Global growth in the use of fixed income ETFs is an important trend and the introduction of ETFs in less liquid asset classes like Sukuk can definitely help drive liquidity.

Exhibit 1: Dow Jones Sukuk Index – Total Return Performance
Exhibit 1: Dow Jones Sukuk Index – Total Return Performance                                                                                Source: S&P Dow Jones Indices LLC and/or its affiliates. Data as of September 30, 2013. The Chart is provided for illustrative purposes. Past performance is no guarantee of future results. Historic returns included back-testing.


The posts on this blog are opinions, not advice. Please read our Disclaimers.